


Buy low, sell high is one of the most well-known principles in investing.
It’s a simple theory, but can be difficult to execute in practice.
The strategy involves buying the dip when Bitcoin falls and selling when it rises.
The goal is to profit from the market volatility.
This guide breaks down how “Bitcoin sell high, buy low” works, the tools expert traders use, and common mistakes to avoid.
| 🪙 Step | What It Means | Why It Matters |
|---|---|---|
| 1. Buy Low | Purchase Bitcoin when the price is below average or in a dip. | Helps maximize gains when prices rebound. |
| 2. Hold | Keep your Bitcoin in secure storage while waiting for the market to rise. | Allows your asset to appreciate in value over time. |
| 3. Sell High | Sell when Bitcoin reaches a significantly higher price. | Locks in profit and capitalizes on your initial low purchase price. |
The Core Principles Of Bitcoin Sell High, Buy Low
The Bitcoin sell high, buy low strategy has been applied to many different trading assets.
It’s a popular strategy, but since Bitcoin’s market is SO volatile, it needs a lot of attention to turn a real profit.
POV: Imagine you bought 1 Bitcoin at $20,000 and later sold it when the price hit $30,000. Your profit would have been $10,000, a 50% return.
This is the ideal scenario, but catching these price movements in real time is rarely so clear and easy to achieve.
The crypto market is famously volatile, which can provide many opportunities to buy low, sell high, but it also can expose you to quick and unexpected downturns in the market.
Many experts in crypto trading agree that timing the market is hard.
Yes, there are many strategies and Bitcoin analysis tools to use, but what you first need to determine is YOUR GOAL.
View this post on Instagram
As a leading provider of ultra-secure cold storage solutions, Material Bitcoin is committed to helping you understand Bitcoin trading and protect your crypto gains once the trade is done.

Our experience in the Bitcoin space has shown that securing profits is just as important as making them. Safety and long-term strategy are essential parts of the trading equation.
The Psychology Behind Market Timing
Successfully utilizing the “Bitcoin sell high, buy low” strategy isn’t just about charts and price points.
It’s also about overcoming your human psychology.
Emotions, such as FOMO (fear of missing out) and panic selling, are real threats that can cause traders to buy when prices are peaking and sell during corrections.
This is the opposite of what this strategy is.
What Can You Do to Overcome Emotional Buying and Selling
| ✅ Strategy | 📘 Purpose |
|---|---|
| Use Limit Orders | Avoid overpaying during price spikes and stick to your buying targets. |
| Have a Plan | Set clear price targets to sell portions of your holdings and lock in gains. |
| Stay Informed, Not Emotional | Follow reliable news; avoid hype-driven decisions (FOMO or panic selling). |
| Use Cold Storage for Long-Term Holds | Keep your long-term crypto safe and less accessible for impulse selling. |
How to Use Technical Indicators
⚠️ Disclaimer: The following section explores technical analysis indicators used to time Bitcoin trades. These tools require a moderate to advanced knowledge of Bitcoin chart reading and should be used with caution, especially by beginners.
Using RSI Tools
The Relative Strength Index (RSI) is a tool that shows how fast and how much an asset’s price has changed. This is what shows traders if the asset is overbought or oversold.
📊 RSI Buy & Sell Signals
The Relative Strength Index (RSI) ranges from 0 to 100 and is used to identify potential entry and exit points.
- 🔴 RSI Above 70: Bitcoin may be overbought: possible sell signal.
- 🟢 RSI Below 30: Bitcoin may be oversold: possible buy signal.
Case Study: April 2025
In April 2025, Bitcoin’s Relative Strength Index climbed above 70. This means that the asset was overbought.
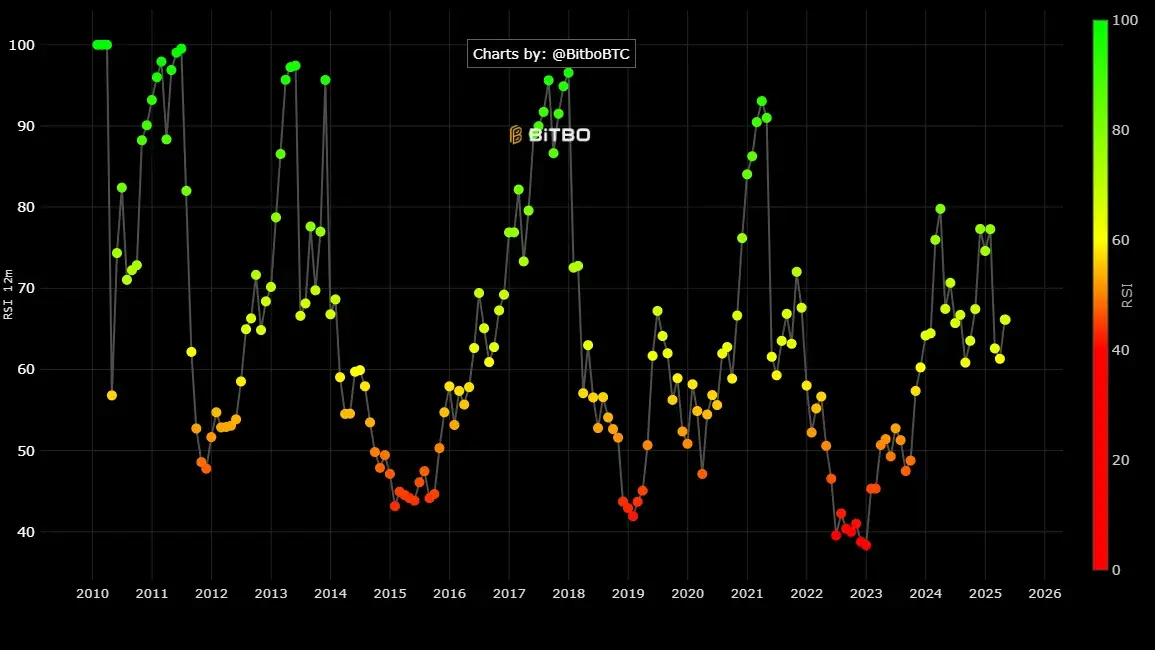
Around the same time, Bitcoin’s price reached a high of approximately $96,910 before pulling back to about $94,207 by the end of the month.
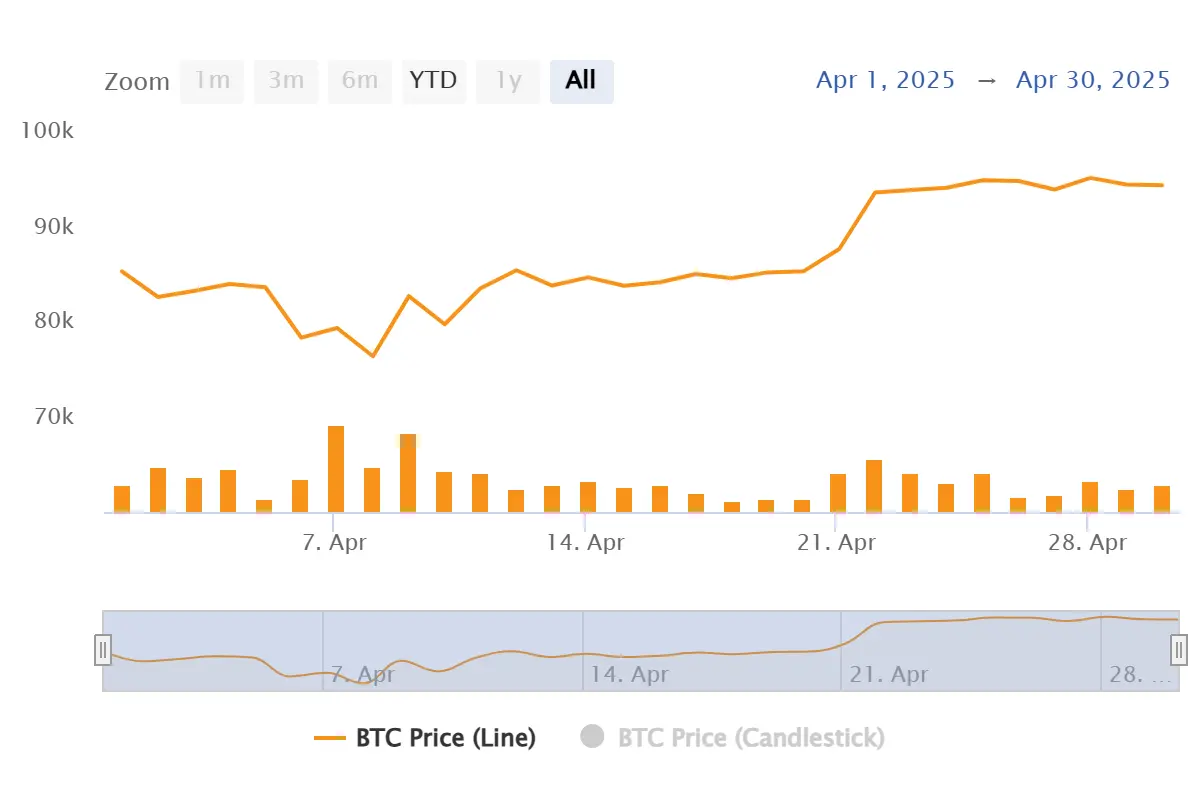
This correction aligns with RSI predictions: when the indicator goes above 70, a short-term price dip usually follows.
A trader who recognized this signal should have taken profits before the decline.
Implementing MACD
The MACD (Moving Average Convergence Divergence) is another popular technical tool that shows changes in momentum and potential trend reversals.
📈 Spotting Momentum Shifts
The MACD indicator helps identify potential trend reversals by analyzing moving averages.
- 🔹 MACD Line: 12-day EMA minus 26-day EMA
- 🔹 Signal Line: 9-day EMA of the MACD
- 🟢 Bullish Crossover: MACD crosses above Signal Line: possible buy signal
- 🔴 Bearish Crossover: MACD crosses below Signal Line: possible sell signal
Case Study: April 2025
In mid-April 2025, Bitcoin’s MACD indicator was showing a bullish crossover.
This happens when the MACD line moves above the signal line, signaling a potential price increase.
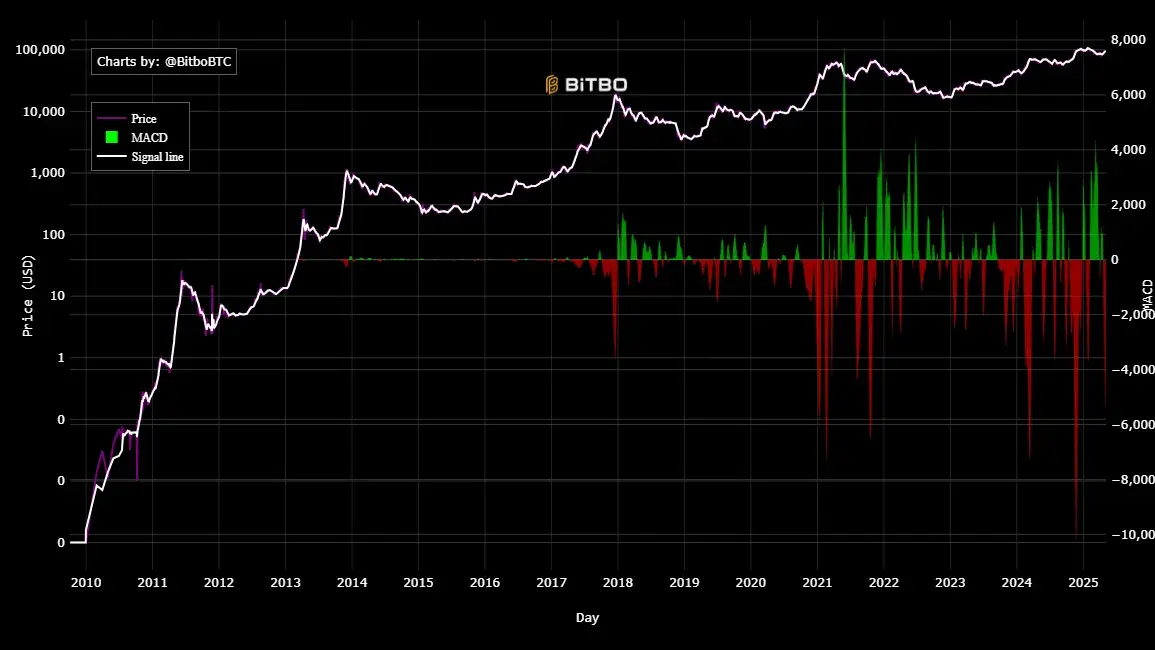
After this signal, Bitcoin rose from around $83,415 on April 5 to about $97,000 by May 2, a gain of 16.29%
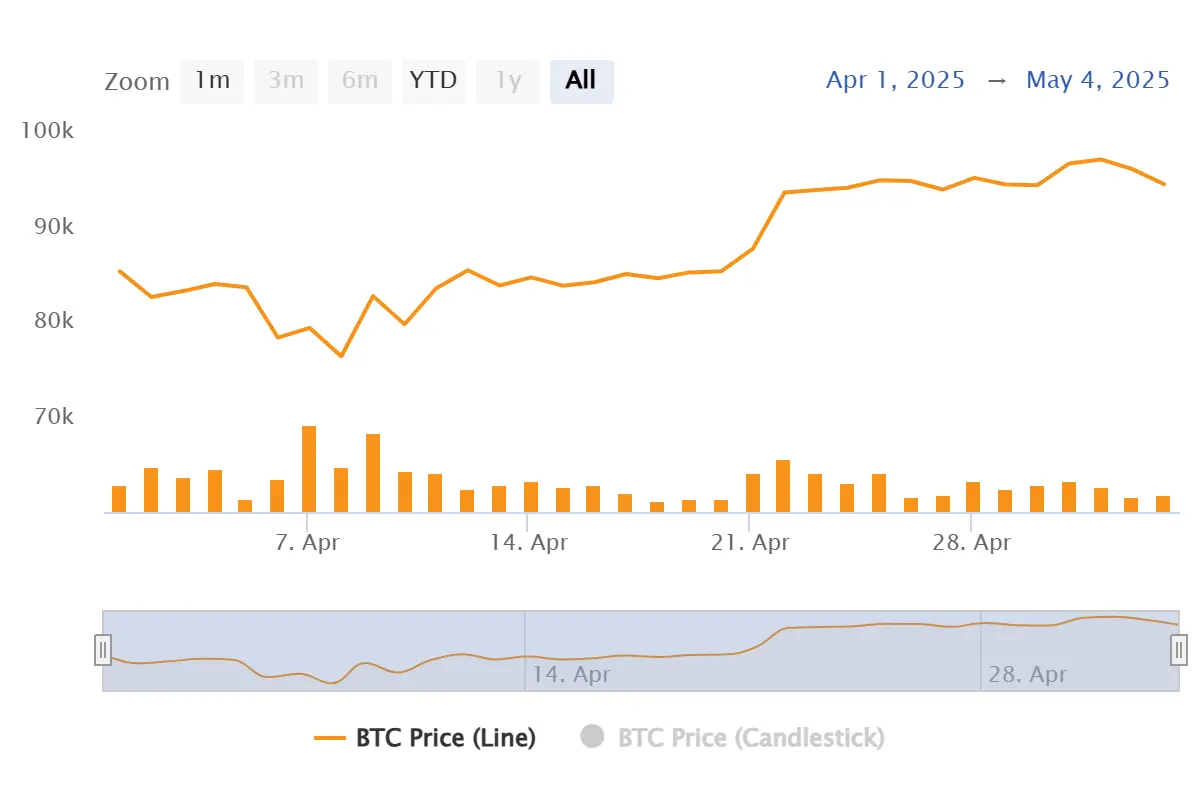
This kind of price jump has happened before, after MACD crossovers.
MACD is useful for trend-following strategies and is often used together with RSI.
Moving Averages in Identifying Market Trends
Moving Averages (MAs) help “smooth out” price data to spot long-term and short-term trends.
📊 Moving Averages
The two most common types of moving averages are:
- 📘 Simple Moving Average (SMA): Gives equal weight to all price data.
- 📘 Exponential Moving Average (EMA): Gives more importance to recent prices.
Popular timeframes include the 50-day, 100-day, and 200-day moving averages.
- 🟢 Golden Cross: 50-day MA crosses above 200-day MA: often signals a bullish trend.
- 🔴 Death Cross: 50-day MA crosses below 200-day MA: often signals a bearish trend.
Case Study: MA Golden Cross
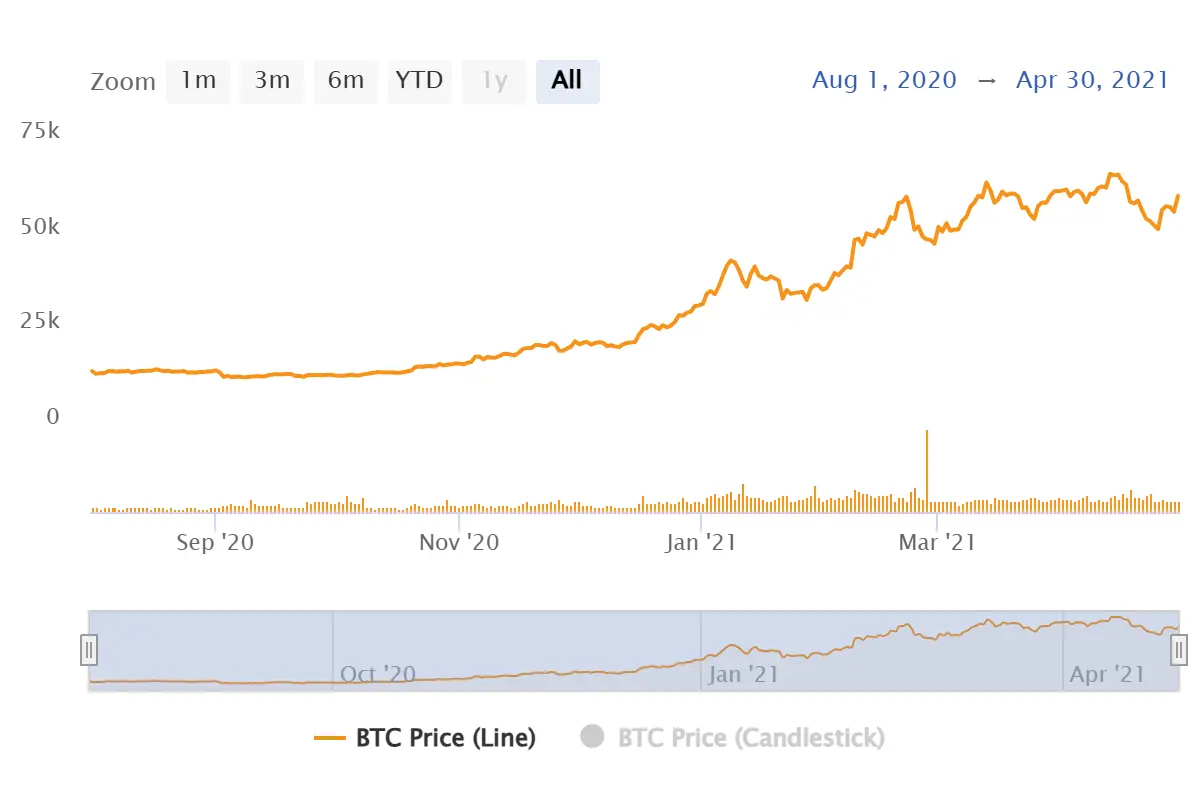
In August 2020, Bitcoin’s 50-day MA crossed above the 200-day MA, forming a golden cross around $9,500.
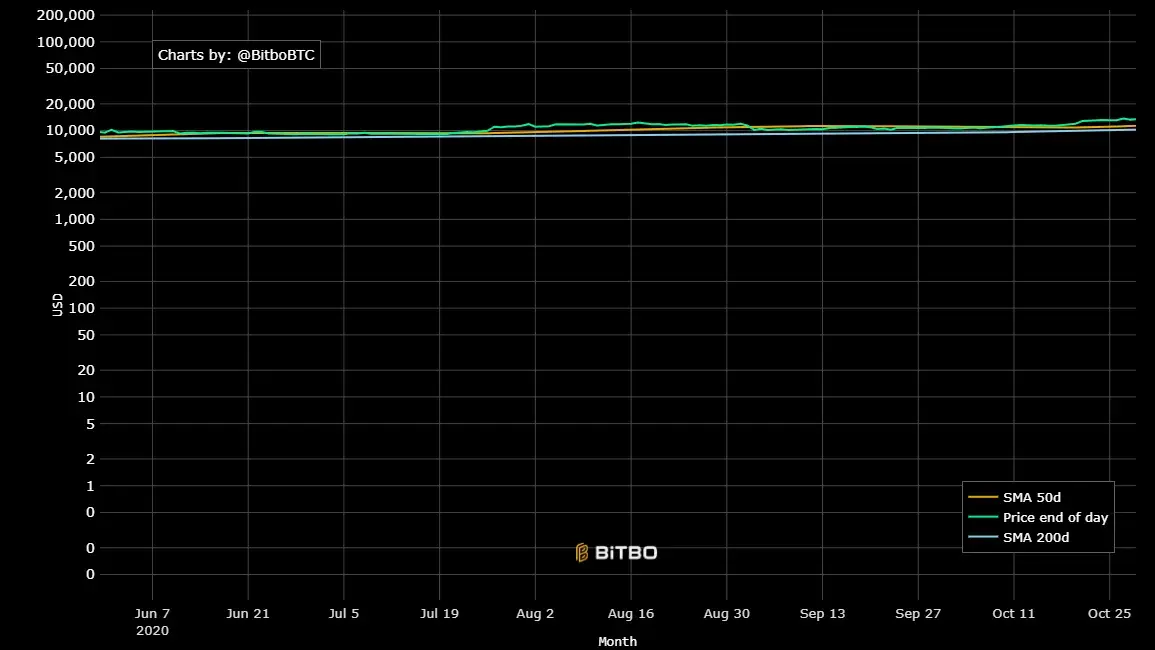
This event came right before a long bull run that took Bitcoin to over 67,000 by April 2021.
Using these indicators doesn’t guarantee success, but they can improve your chances of making smarter decisions, especially when used with solid risk management and an understanding of market conditions.
Tools and Platforms for Effective Trading
Once you know which strategies to put into place, there are a few useful tools you can utilize to help you achieve your Bitcoin investing strategy.
Suggested Charting Platforms for Technical Analysis
Effective technical analysis is crucial for successful Bitcoin trading.
There are several platforms available:
| Tool | Features | Best For |
|---|---|---|
| TradingView | Custom charts, technical indicators, community scripts, and real-time data | Traders who want flexibility and precision charting |
| Coinigy | Integrated trading and charting across multiple exchanges | Multi-exchange traders seeking all-in-one tools |
| Kraken Pro | Real-time data, secure environment, and pro charting tools | Advanced traders wanting fast execution and safety |
| Material Bitcoin | Bi-weekly Bitcoin technical analysis updates, tailored for long-term holders using cold storage | Bitcoin investors focused on security and strategic timing |
These platforms will help you with the necessary tools to analyze market trends, identify trading opportunities, and manage risks effectively.
Trading Bots and AI
AI trading bots are tools that automatically buy and sell crypto for you by using algorithms and live market data.
They’re meant to take emotions out of trading and make quicker, data-driven decisions.
But they’re not perfect.
Their ability depends on how accurate the AI is, the data it uses, and what’s happening in the market.
They can also make mistakes in fast-changing conditions and may pose security risks if not set up securely.
That’s why it’s important to test them first, keep an eye on how they perform, and not rely on them alone to manage your trades.
| Advantages ✅ | Risks ⚠️ |
|---|---|
| Operates 24/7 without human fatigue | May misinterpret sudden market changes |
| Executes trades faster than manual methods | Poorly trained AI models can result in losses |
| Removes emotional bias from decisions | Targets for cyberattacks and hacks |
| Can analyze large amounts of market data quickly | Still needs human oversight and strategy tuning |
Resources for Learning and Community Engagement
Engaging with communities and utilizing educational resources can enhance trading skills and knowledge:
| Resource | Description |
|---|---|
| r/CryptoCurrency & r/BitcoinBeginners |
Active Reddit forums for market discussions, beginner tips, and real-time crypto insights. |
| Books & Courses | “Mastering Bitcoin” by Andreas M. Antonopoulos and online tutorials provide great starting points for blockchain education. |
| Material Bitcoin Blog | Covers Bitcoin security, wallets, trends, and tutorials. Updated with 3 expert-written articles every week. |
Risk Management in Bitcoin’s Volatile Market
1️⃣ Setting Effective Stop-Loss and Take-Profit Levels
- Use stop-losses to cut losses and take-profit orders to lock in gains.
2️⃣ Diversification Strategies to Spread Risk
- Spread your investments across different assets and strategies like arbitrage trading, and timeframes like buying the dip are useful, but consider both lump sum buys and DCA.
3️⃣Position Sizing
- Before entering a trade, you should carefully choose how much money to invest, based on how much you’re willing to lose if the trade goes wrong.
🔒 No matter your strategy, always secure profits in cold storage.
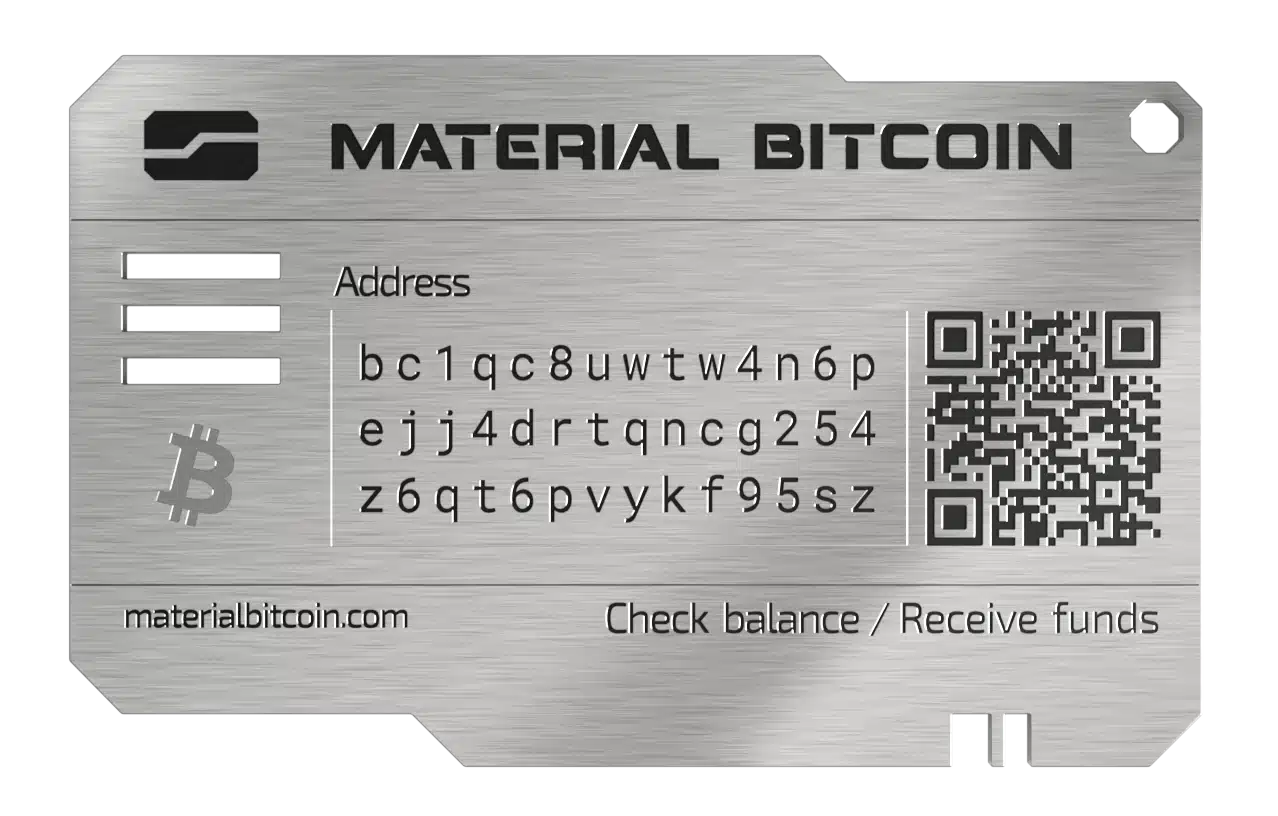
Material Bitcoin offers the best place to store your Bitcoin.
A safe and simple way to keep your Bitcoin offline, protecting it from hacks and exchange failures.
FAQs
Is the “Bitcoin Sell High, Buy Low” strategy good for beginners?
- It’s a simple idea, but it might be hard to execute for all. Beginners should start small and use tools to help.
How do market conditions affect this strategy?
- Volatile markets offer more chances but also higher risk. In calm markets, price swings are usually too small to profit from.
Can this approach be automated effectively?
- Yes, with trading bots or AI platforms, but they need careful setup and constant monitoring.


0 Comments