


Ethereum is the second most relevant cryptocurrency in the crypto world, after Bitcoin.
It’s a crypto asset that has other utilities, beyond just accumulating value over time.
Currently, thanks to Ethereum, thousands of projects of all kinds such as Decentralized Finance or NFTs have emerged.
This makes the native token of the Ethereum network (ETH) necessary to trade in all these emerging projects, simultaneously increasing the demand and price of ETH.
To learn more about Ethereum, here is an analysis and forecast of its chart in depth. I will update it every 15 days, so you don’t miss anything. 😉
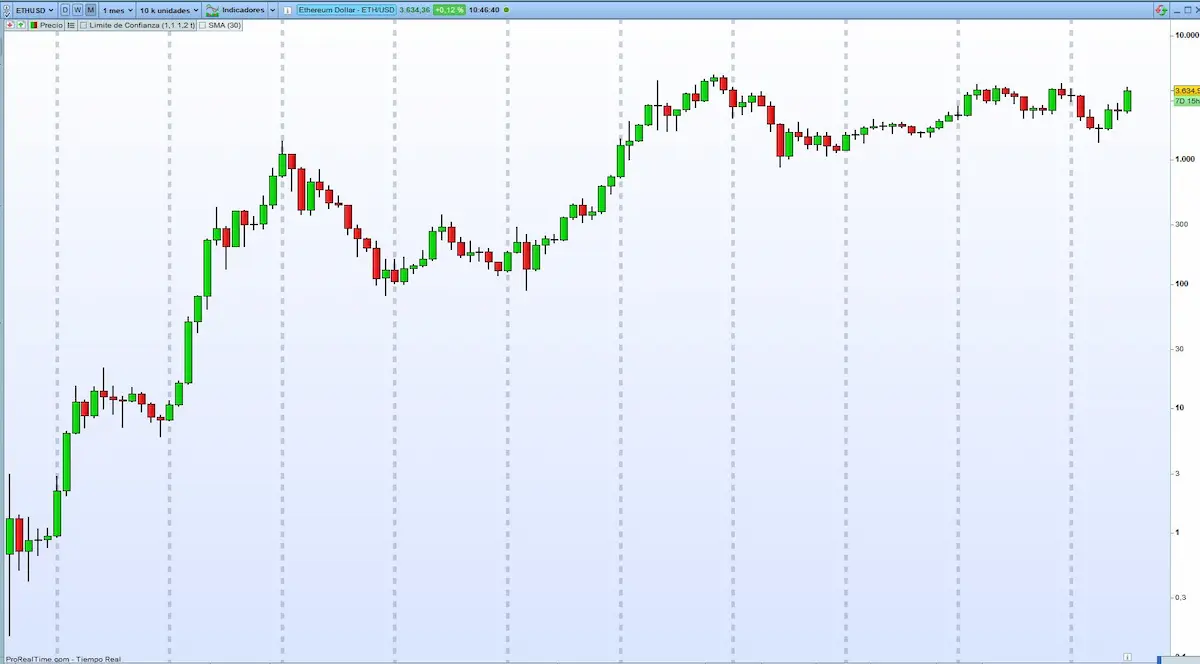
Chart of Ethereum (ETH)
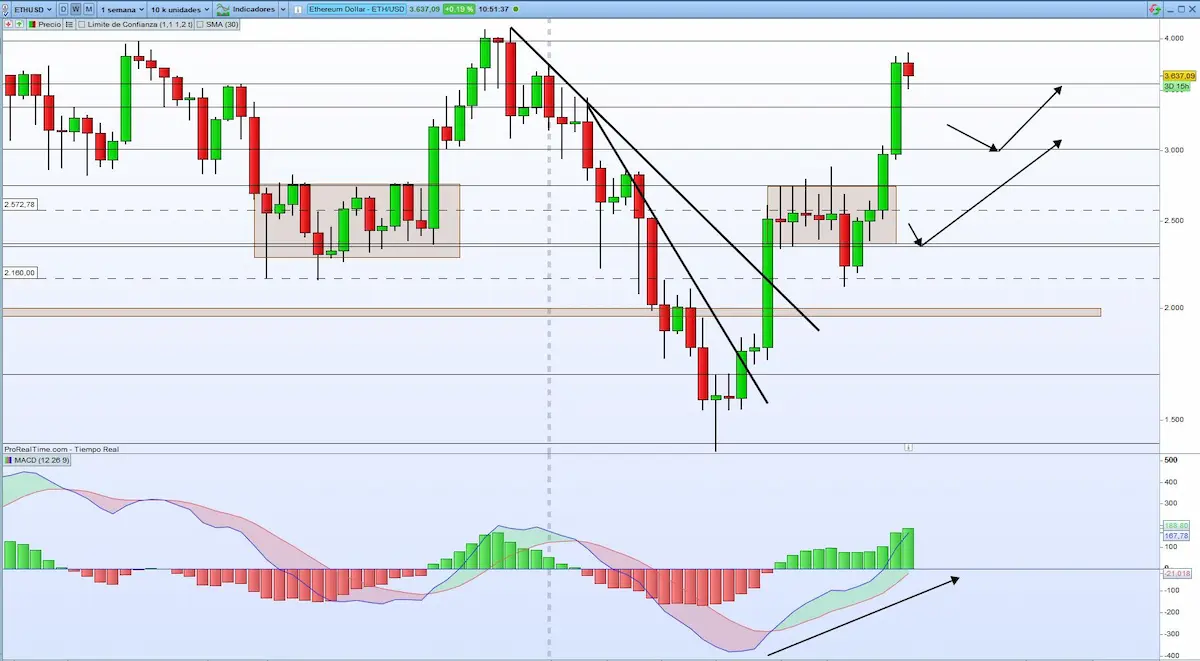
This chart is clearly in a long-term uptrend. Right now (July 24, 2025), Ethereum is trading around $3,600.
Price has been dropping throughout 2025 — this could be a great time to start looking for solid buying opportunities.
What do you think is going on?
Technical Analysis Ethereum
It’s important to read charts and their context well, such as detecting supports and resistances, checking the trend of the chart, etc.
What technical indicators does today’s Ethereum chart show?
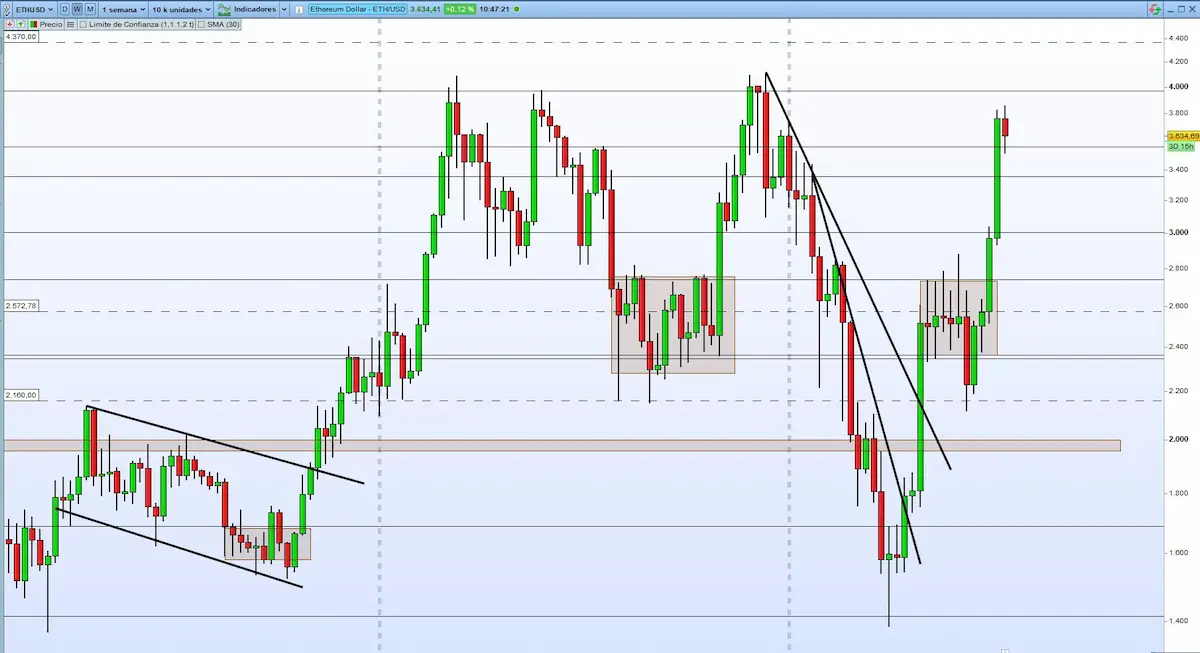
1- Supports and Resistances
Supports are below the price and resistances are above.
Where are the levels located on this chart?
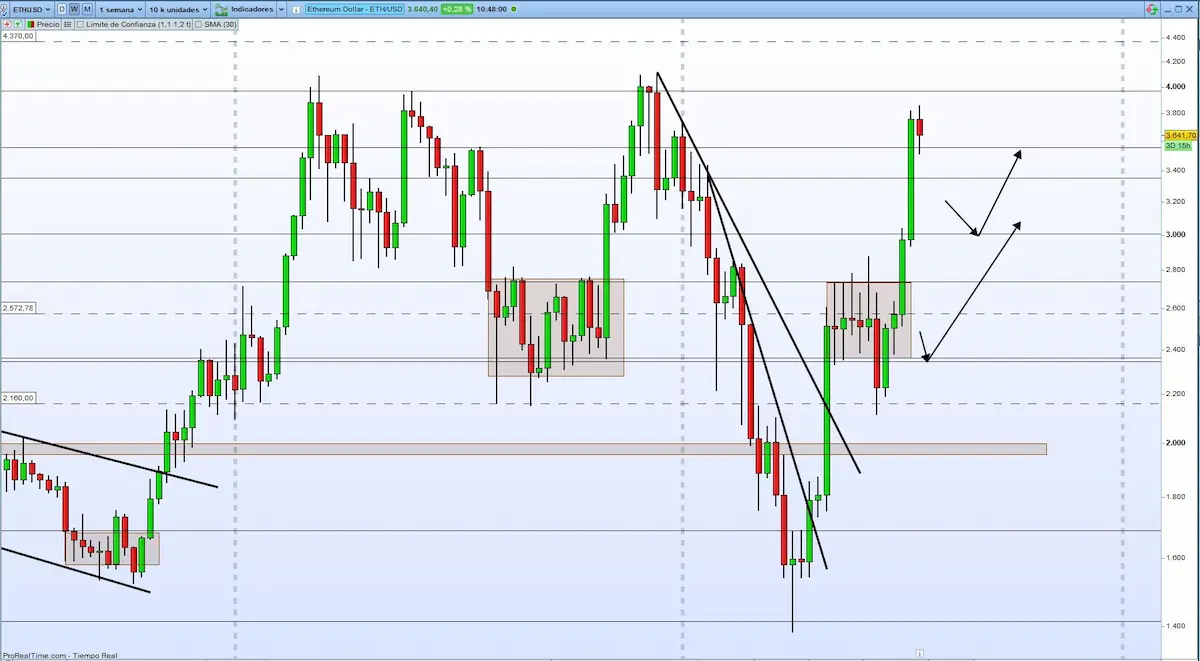
2- Where to Enter and Where to Exit
If you intended to manually exit the operation, you can forget that idea.
Placing your entry, exit, or even the stop loss correctly is important.
You should consider what kind of investor you are. If you want to buy Ethereum for the long term (holder), you would wait for support zones to accumulate positions. You wouldn’t mind much if the price fluctuated.
However, if you like to trade (swing trader), you need to be clear about where to place your entry, your stop loss, and your risk.
3- Weekly Average
You may have noticed that in the charts of the medium-term strategy (weekly charts) there is always a moving average.
My advice is that you clearly define two colors in your moving average for when it rises or falls. When the average constantly changes color, it is indicating a lateral phase.
I have configured it in the following way:
- The blue color indicates bullish moments.
- The red color indicates bearish phases.
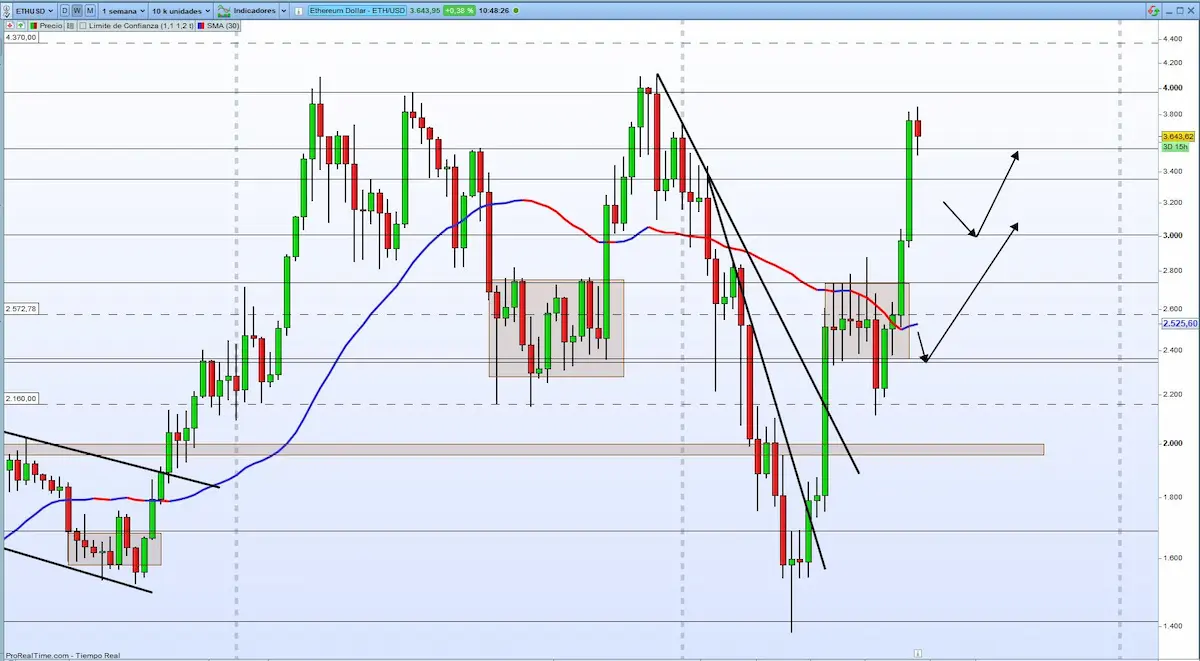
The weekly moving average has been trending up for weeks, and price is on a tear.
Right now, there’s a big price-to-value gap due to the rally we’ve seen. We need to wait for price to cool off and react at one of the key levels before the uptrend can resume.
Does that make sense to you? What would you do here?
4- Divergences
Divergence is the opposite of convergence.
If converging means “directing towards the same point,” diverging is “behaving in the opposite manner.”
Thus, in technical analysis, a divergence occurs when the price and an indicator have opposite behaviors at their extremes. That is, one rises and the other falls.
Let’s analyze the Ethereum chart. At first glance, what do you detect?
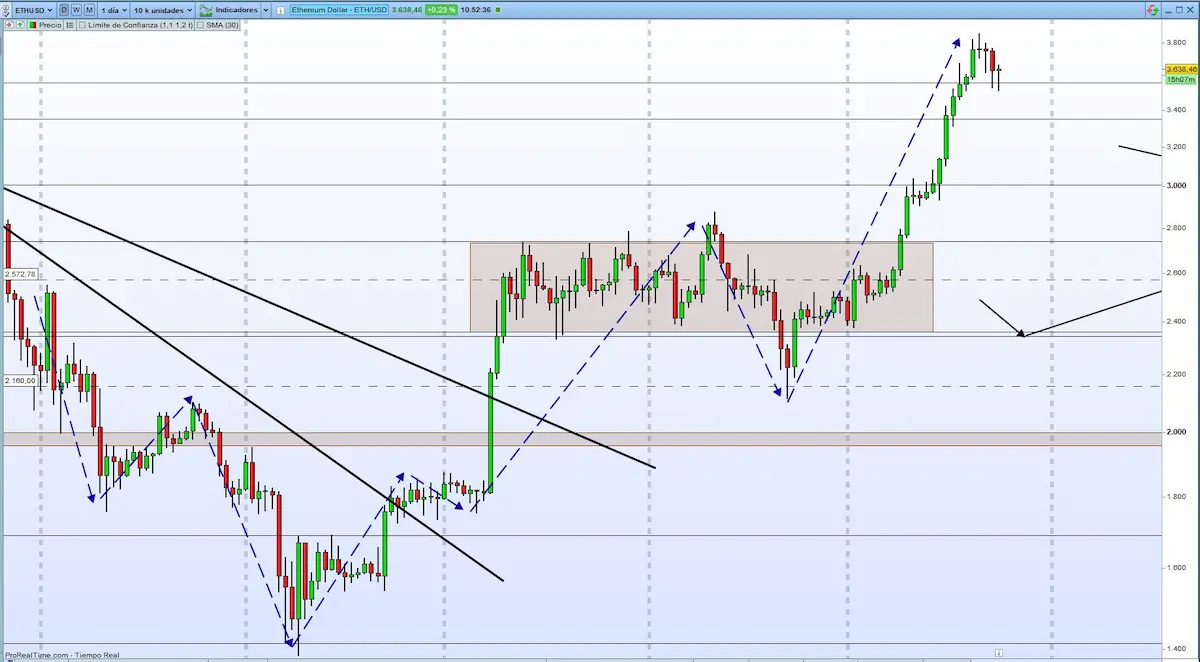
5 – Price Structure
Technical analysis serves to predict what the price will do. We often use different techniques such as divergences with indicators, trend lines, patterns, etc.
But the most important thing is what the price is “drawing,” what you will know as price structure. No asset moves in a straight line constantly. Sooner or later, there is a lot of tension in one direction, and there is an imbalance between buyers and sellers that needs to be rebalanced.
This causes the price to create the famous swings or impulses and retracements, which are creating structures of highs and lows in one direction. Understanding how these movements are created will give you clarity when detecting the trend of the asset you are looking at.
What’s happening with Ethereum?
6 – Volatility
Volatility is usually a sign that the price is accelerating in a direction.
To understand the volatility Ethereum has, you’ll need to look at the candlesticks.
Remember, the interpretation of Japanese candles in trading is a matter of common sense.
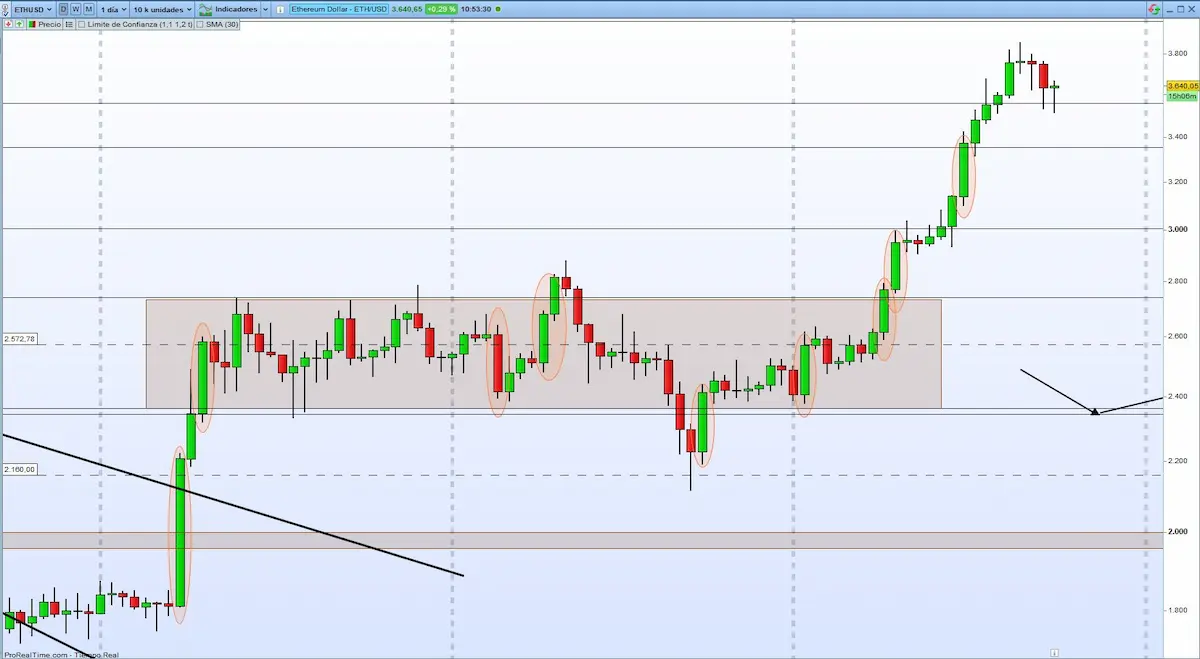
On the chart, we’ve highlighted (in orange) the recent periods where Ethereum showed high volatility.
We can clearly see that this spike in volatility lines up with strong upward moves — all backed by heavy accumulation from smart money driving this bullish trend.
There’s no doubt about their intent during this leg up, even though the bounce includes a few bearish candles…
It’s still early to call it, but if this structure holds — with strong hands in control and higher highs and higher lows — it could very well be the start of a solid uptrend.
What’s your take?
Forecast with Ethereum
As you already know, trading with Ethereum is not easy. Therefore, it’s crucial to educate yourself first to become profitable. Remember to store Ethereum in the safest ETH wallet in the world, Material Ether.
And, of course, don’t forget to follow the Bitcoin chart with me. Don’t buy just because the price reaches support; always wait for confirmation of the stop. If you have doubts or questions, feel free to join our Telegram channel.
For more in-depth analysis, check out our trend analysis of Bitcoin.


0 Comments