


As could be expected, Bitcoin is and will continue to be the best cryptocurrency on the market. Its scarcity, security, decentralization, transparency, and global acceptance as a store of value are the characteristics that allow it to be a fundamental pillar in the crypto world today. To learn more about Bitcoin, let’s analyze its chart in depth. Are you joining us?
Bitcoin Chart
Right now, Bitcoin is priced at $118,000 — that’s a rise of over 600% since the lows of late 2022. Pretty incredible, right? What do you think is going on?
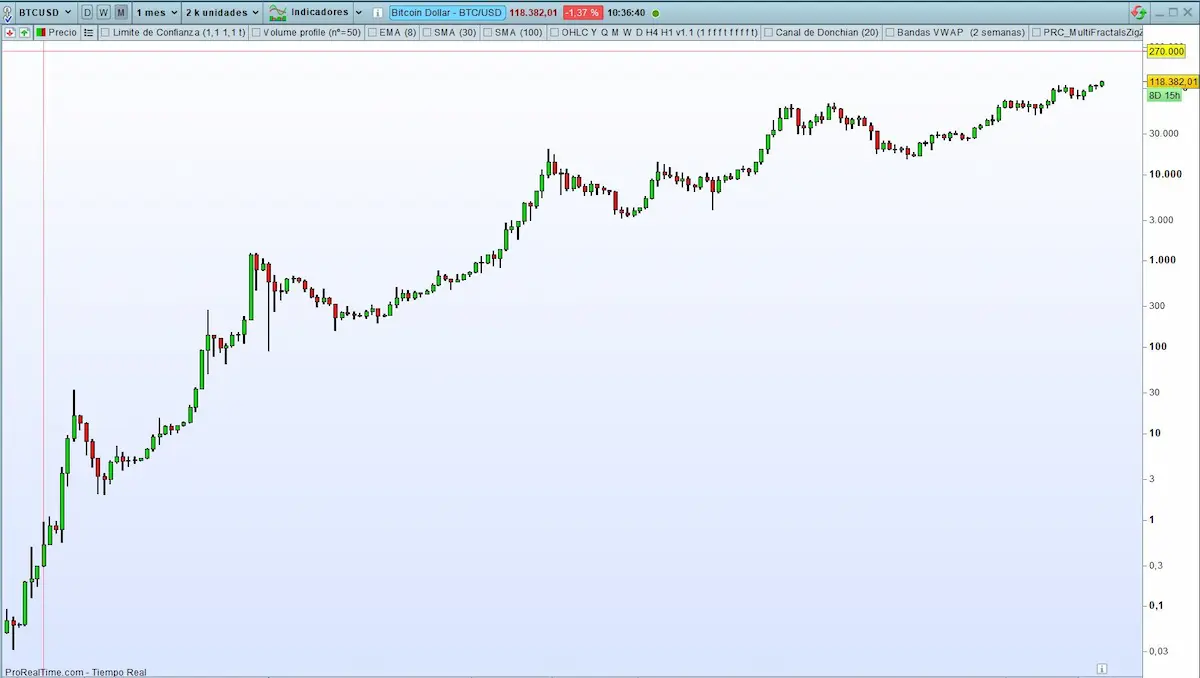
If we switch to the weekly chart, you’ll see that the price has been in an uptrend for years, consistently forming higher highs and higher lows.
That said, this past week — and part of the previous one — we’ve seen an incredible surge, breaking through all-time highs once again.
Technical Analysis of Bitcoin
To perform a technical analysis of Bitcoin, it is essential to read the charts and their context well such as the trend of the chart, the patterns of entry and exit, the supports and resistances, etc. Therefore, let’s analyze all the technical indicators that today’s Bitcoin chart displays.
1- Supports and Resistances
The difference between support and resistance is minimal—they’re essentially the same concept, just positioned differently:
- Support levels are below the price and act as a floor where buyers step in.
- Resistance levels are above the price and serve as a ceiling where sellers tend to take profits.
Where are these levels on Bitcoin’s chart?
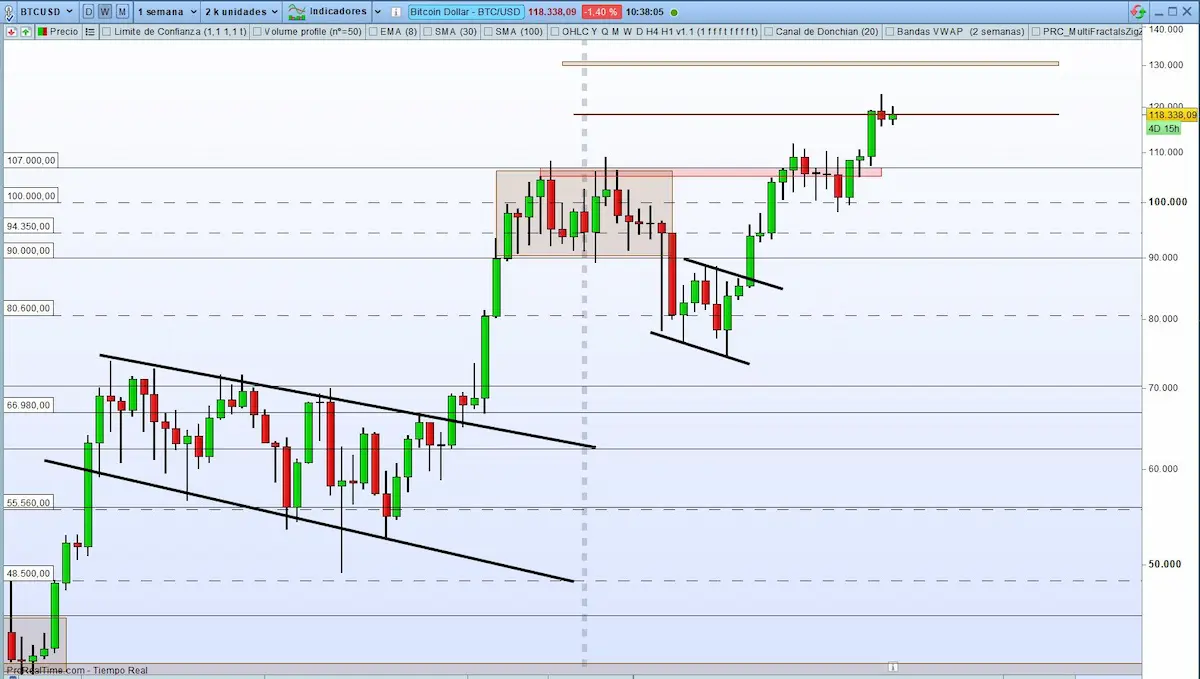
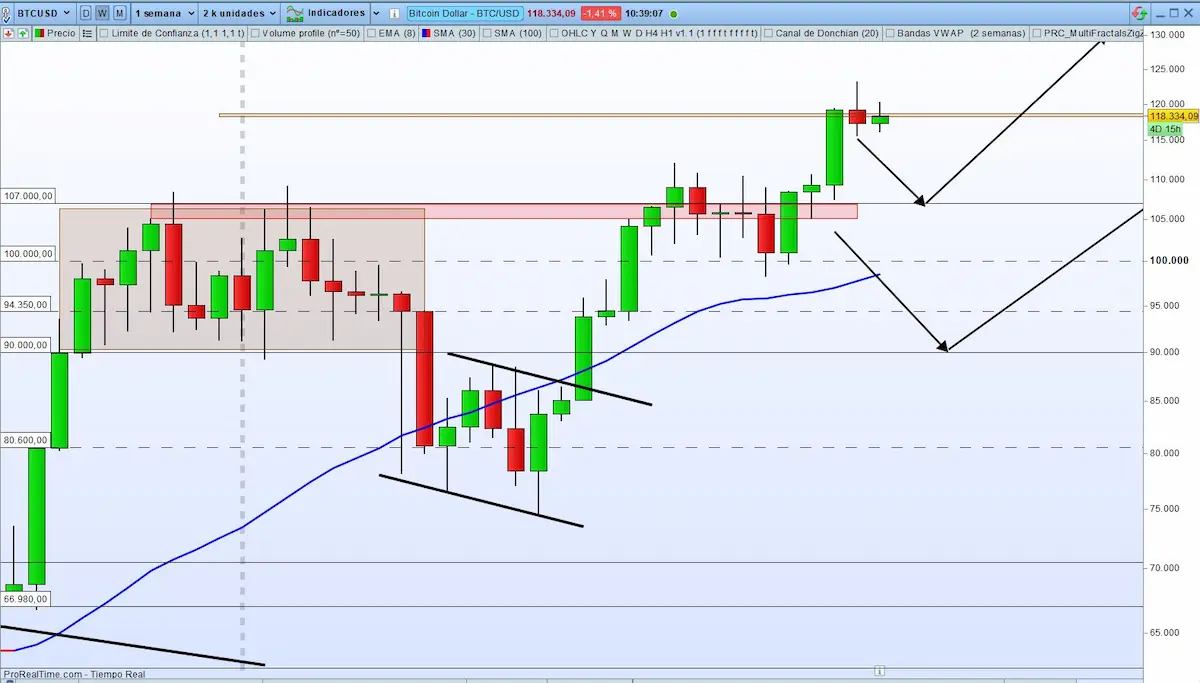
As you can see, Bitcoin had been in a strong downtrend, and the $17,000 area helped slow things down a bit.
After breaking below that support, it faked out and moved back up, starting the uptrend we’re currently seeing.
This entire bullish trend has allowed buyers to push hard, eventually reaching a new all-time high at $123,200.
It’s worth highlighting the two reaccumulation zones along the way — they played a key role in helping price build momentum to keep climbing.
Now, after breaking the December highs, the trend has held, and price moved sideways for several months. Then came a significant drop, which pushed it out of that consolidation zone and found temporary support around $80,000.
Currently, the bounce looks strong and has led to a breakout above the psychological level of $100,000, setting a new all-time high at $123,200.
2- Where to Enter and Exit
It is not easy to place your entry price, exit price, or even the stop loss correctly. If you intended to exit the operation manually, you can forget that idea. It will not benefit you at all. Knowing when to enter a trading operation is important, but it is much more important to know how to exit correctly.
So, let’s go. Let’s mark our key points:
You need to ask yourself what type of investor you are.
If you’re in it for the long run (a holder), you’d be looking to accumulate during support zones. You wouldn’t worry too much about price fluctuations.
But if you’re more into trading (a swing trader), then you need to be clear about your entry point, stop loss, and risk level.
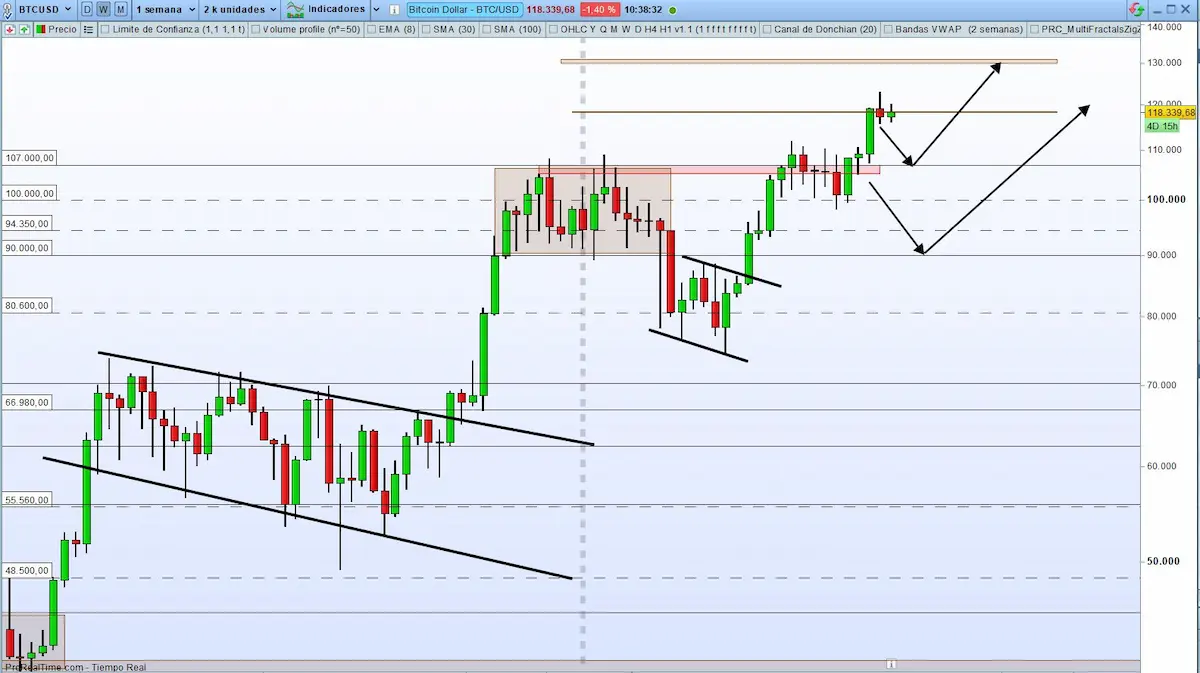
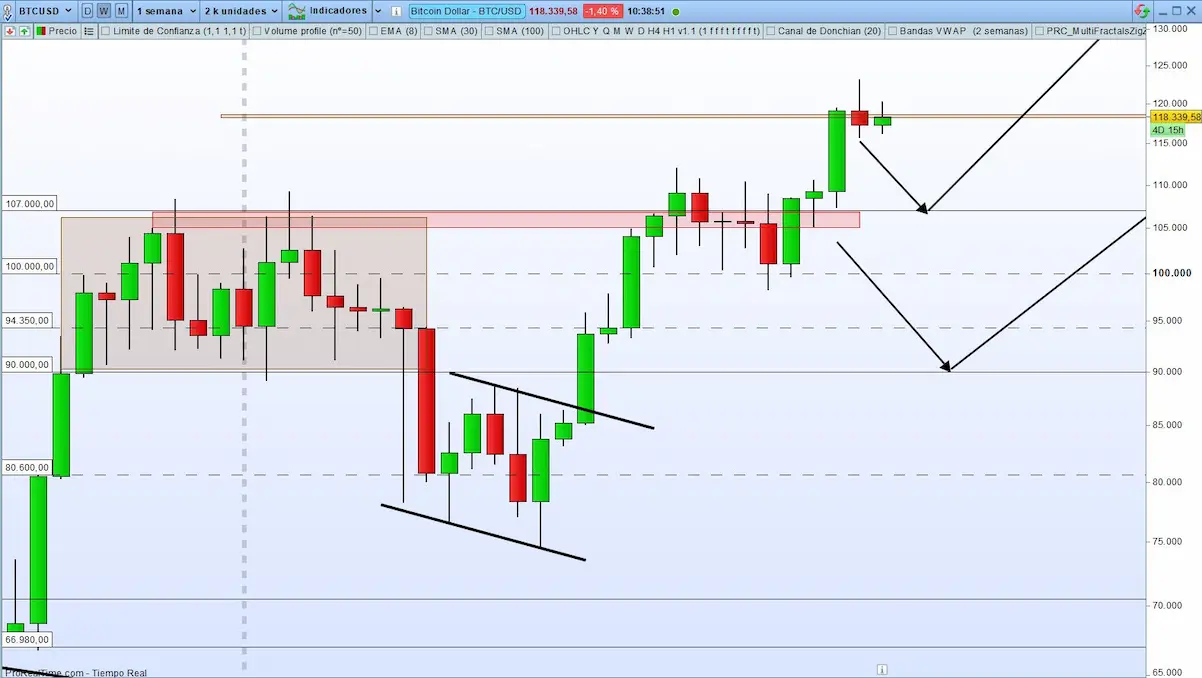
In both cases, you can take advantage of the opportunity I’ve marked on the chart:
If you’re a holder, the current zone could be ideal for accumulating BTC — especially if price consolidates here and gains momentum again. Another option is to wait for a potential drop back to $100,000 or even $90,000. As you know, anything can happen in crypto, so although it’s less likely, price could revisit the $70,000 zone.
On the other hand, if you’re looking to catch a move with swing trading, based on the current setup, that could mean waiting for a pullback to the $107,000 area for a continuation to the upside, or buying around $90,000 aiming for another push to the top.
3- Weekly Moving Average
Today, we can (and should) adjust our technical indicators to assist us. The weekly moving average, although poorly configured, will not lead us to major disasters. Anyway, we have configured it to mark significant differences in terms of precision and utility. The blue line indicates bullish moments, while the red, draws the bearish ones. Let’s see what happens in this case.
4- Divergences
When a divergence occurs, something smells bad, something is wrong, because the price and something derived from the price do not match. If you want to know how to read an indicator when looking for divergences, click here. Now, let’s start detecting those contradictions between the price movement and a technical indicator on the Bitcoin chart.
MACD
There are few occasions when significant divergences of MACD appear on weekly charts. However, when they do appear, caution is necessary because significant changes are coming. Let’s analyze the Bitcoin chart. At first glance, what do you detect? Tell me. 😉
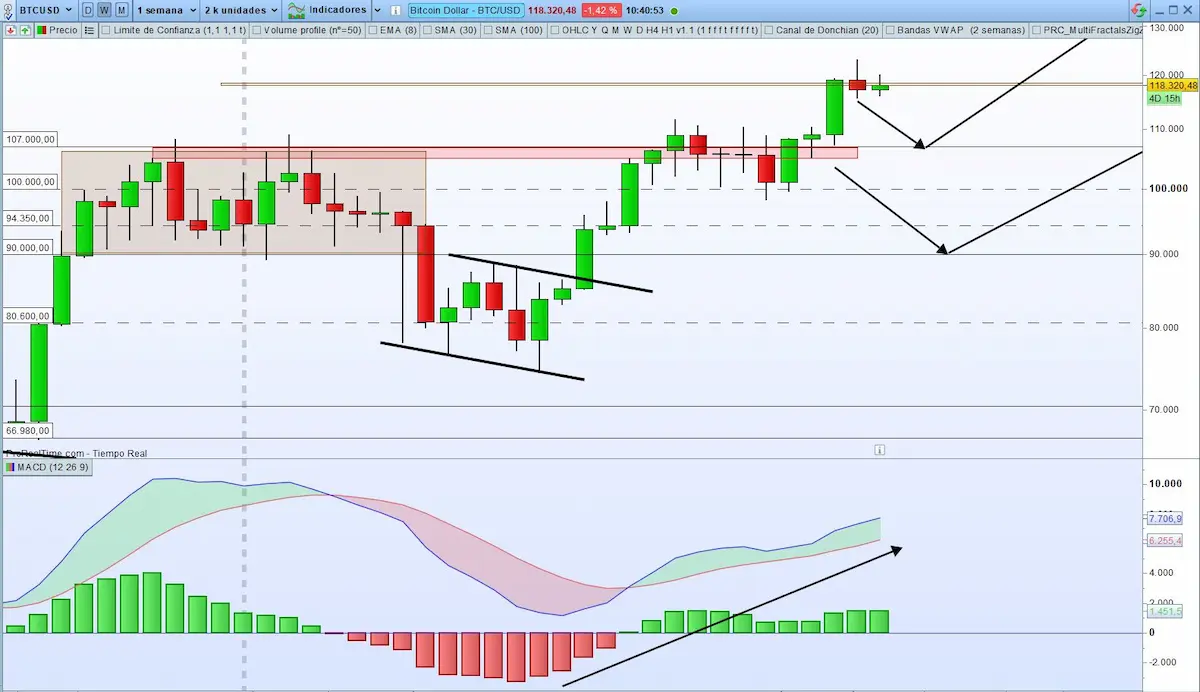
MACD has been climbing for several weeks, and price is following along — so we can say there’s no divergence or any signs of weakness in this move up.
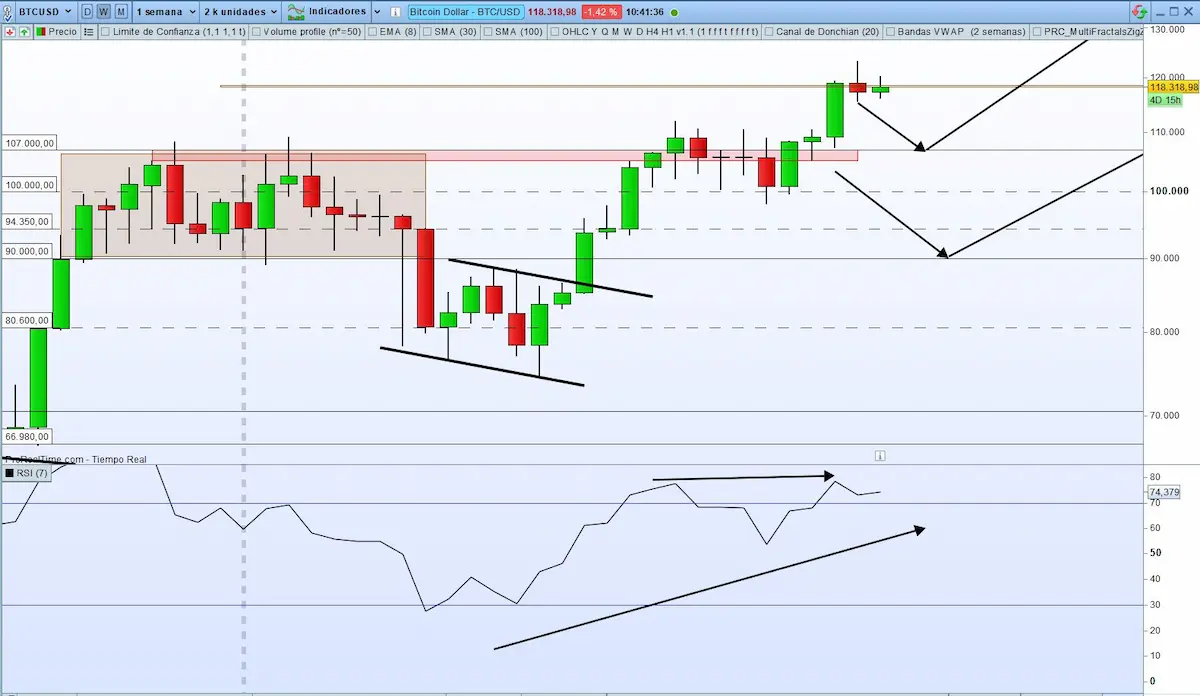
RSI
The RSI moves between 0 to 100 and indicates whether the price is expensive or cheap. Two things could happen:
-
- The price is very high and there is an overbought situation (levels above 70).
- The price is below 30 (oversold or very low).
The triangles in trading form an important part of technical analysis with cryptocurrencies. There are different types of triangles. We have the ascending triangle, the descending triangle, and the symmetrical one. Which one appears in the Bitcoin chart?
For now, we don’t have more compression in the form of triangles, and the price continues a strong rise without many stops.
5- Volatility
Volatility is usually a sign that the price is accelerating in one direction. To know the volatility that Bitcoin currently has, we will look at the Japanese candles. Remember, the interpretation of Japanese candles in trading is a matter of common sense.
The larger candles represent fast price movements. The smaller ones show the opposite: quieter areas.
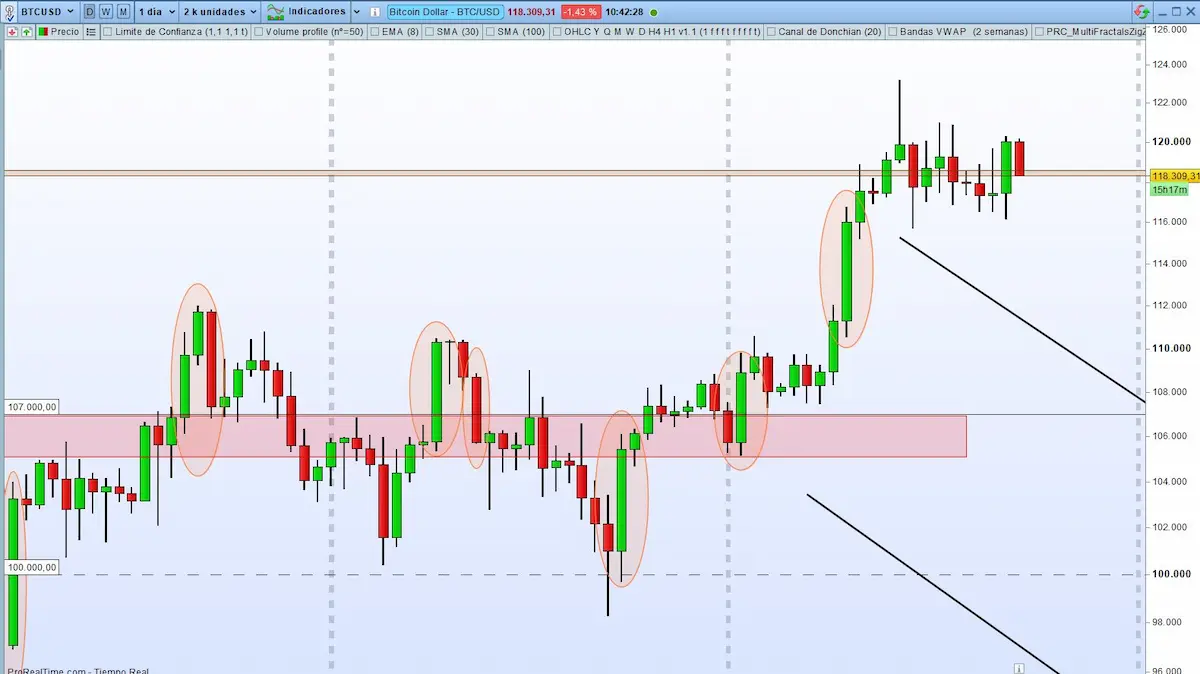
On the daily chart, I’ve marked (with orange circles) the recent periods where Bitcoin showed high volatility.
As you can see, in the last few weeks volatility has picked up to the upside, pushing the price up to where we are now — almost at $118,000.
There’s a clear correlation between this price surge and several strong candles driven by smart money pushing the market higher.
So far, there are no signs of strong selling from institutional players.
Forecast with Bitcoin
If you’ve made it this far, it’s because you already know what this is about. You are clear about what Bitcoin is, but you want to know what will happen with it. We will tell you what could happen from now on. However, we do not promise that it will happen. This is what we deduce from the different patterns, but it is not 100% reliable.
The monthly chart is clearly bullish, and on the weekly we’re still in an uptrend.
The key now is whether price can keep pushing higher and break through the $124,000 level with real conviction.
There’s a lot of hype and FOMO in early 2025, with crypto gaining more and more mainstream attention.
Bitcoin is making history, breaking the major psychological barrier of $100,000. That’s a turning point in the evolution of the cryptocurrency.
From here, if the current momentum and price velocity hold, we could keep seeing further upside — but remember, it all depends on smart money and whether the support zones hold.
Personally, I think we’re in a critical zone. Price needs to break through the all-time high with strength and set a new top — otherwise, we might see pullbacks to the $90,000 area as the market gathers strength.
And that’s not necessarily a bad thing — in fact, those corrections are great opportunities to accumulate more for the long term.
What about you? Would you buy now, or wait for a decent correction to jump in?
If you liked this analysis, I leave you here the analysis and prediction of Ethereum.
Trading with Bitcoin
As you know, trading with Bitcoin is very delicate. Buying and selling, taking advantage of price changes is not a game. You need to be trained to do it effectively and profitably. Anything else will only lead to losing time and money. Don’t you want that? We must enjoy every day as if it were the last, don’t you think?
Don’t procrastinate. If you want to learn how to do it right, practice with us, and remember to store Bitcoin in the world’s safest wallet, Material Bitcoin. 😎 And, of course, don’t forget to keep observing the Bitcoin chart with us. The more you practice, the better you’ll do. However, do not buy just because the price reaches support, always wait for it to confirm the stop.
If you have doubts or questions, join our telegram channel!


0 Comments