Understanding the world of Bitcoin metrics, and historical returns to help you in effectively investing your crypto is highly useful. Still, it can be complicated and you need to learn how to decode the information.
Bitcoin has changed the investment world and the way that we think about money.
As a decentralized asset, the potential for high returns has made investing in BTC great for diversifying and growing portfolios.
But did you know that there are metric tools to help you analyze the market and potential trends?
In this post, we will go over all the aspects of understanding Bitcoin returns, how to analyze data, and indicate trends.
Understanding Bitcoin’s Performance Metrics
Before attempting to decipher Bitcoin charts and forecast trends, it’s important to grasp how Bitcoin performs. To do so, you must be familiar with the metrics used to measure its performance.
1️⃣Return on Investment (ROI)
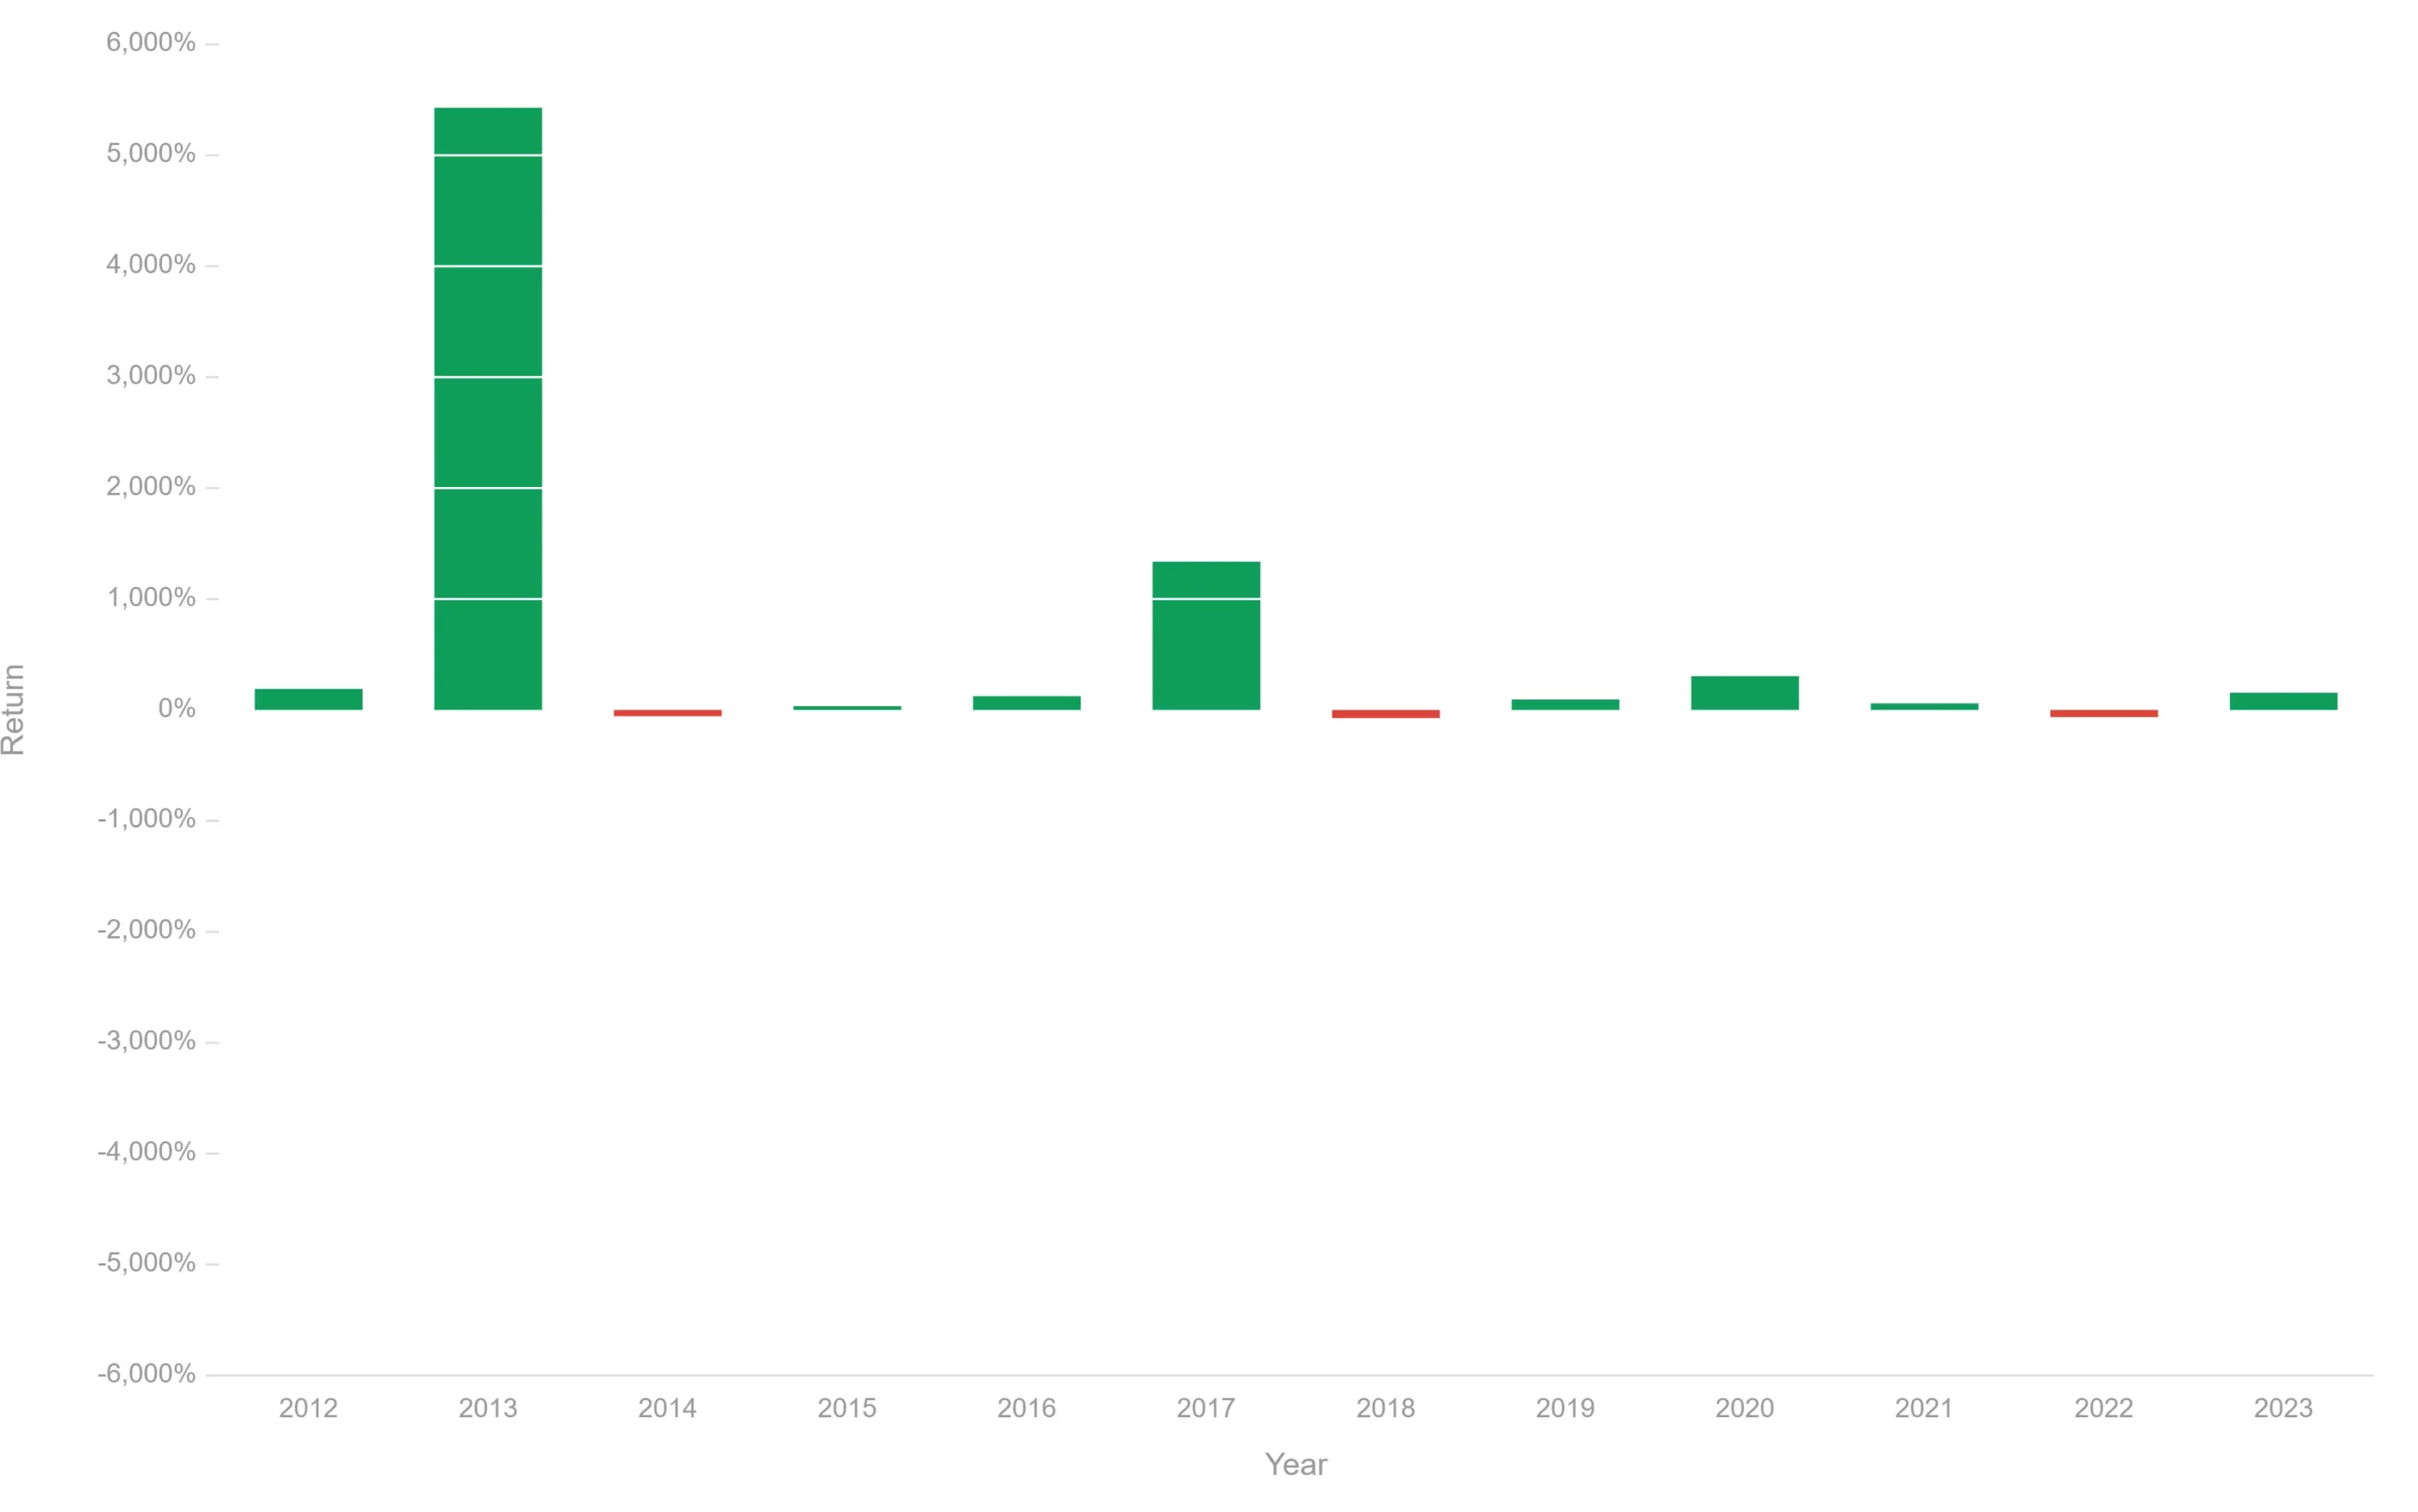
This metric measures the profitability of an investment. It’s calculated by dividing the net profit by the upfront cost of the initial investment. As Bitcoin has fluctuated significantly, the ROI for BTC will vary dramatically depending on the year/month the initial investment was made.
2️⃣Volatility
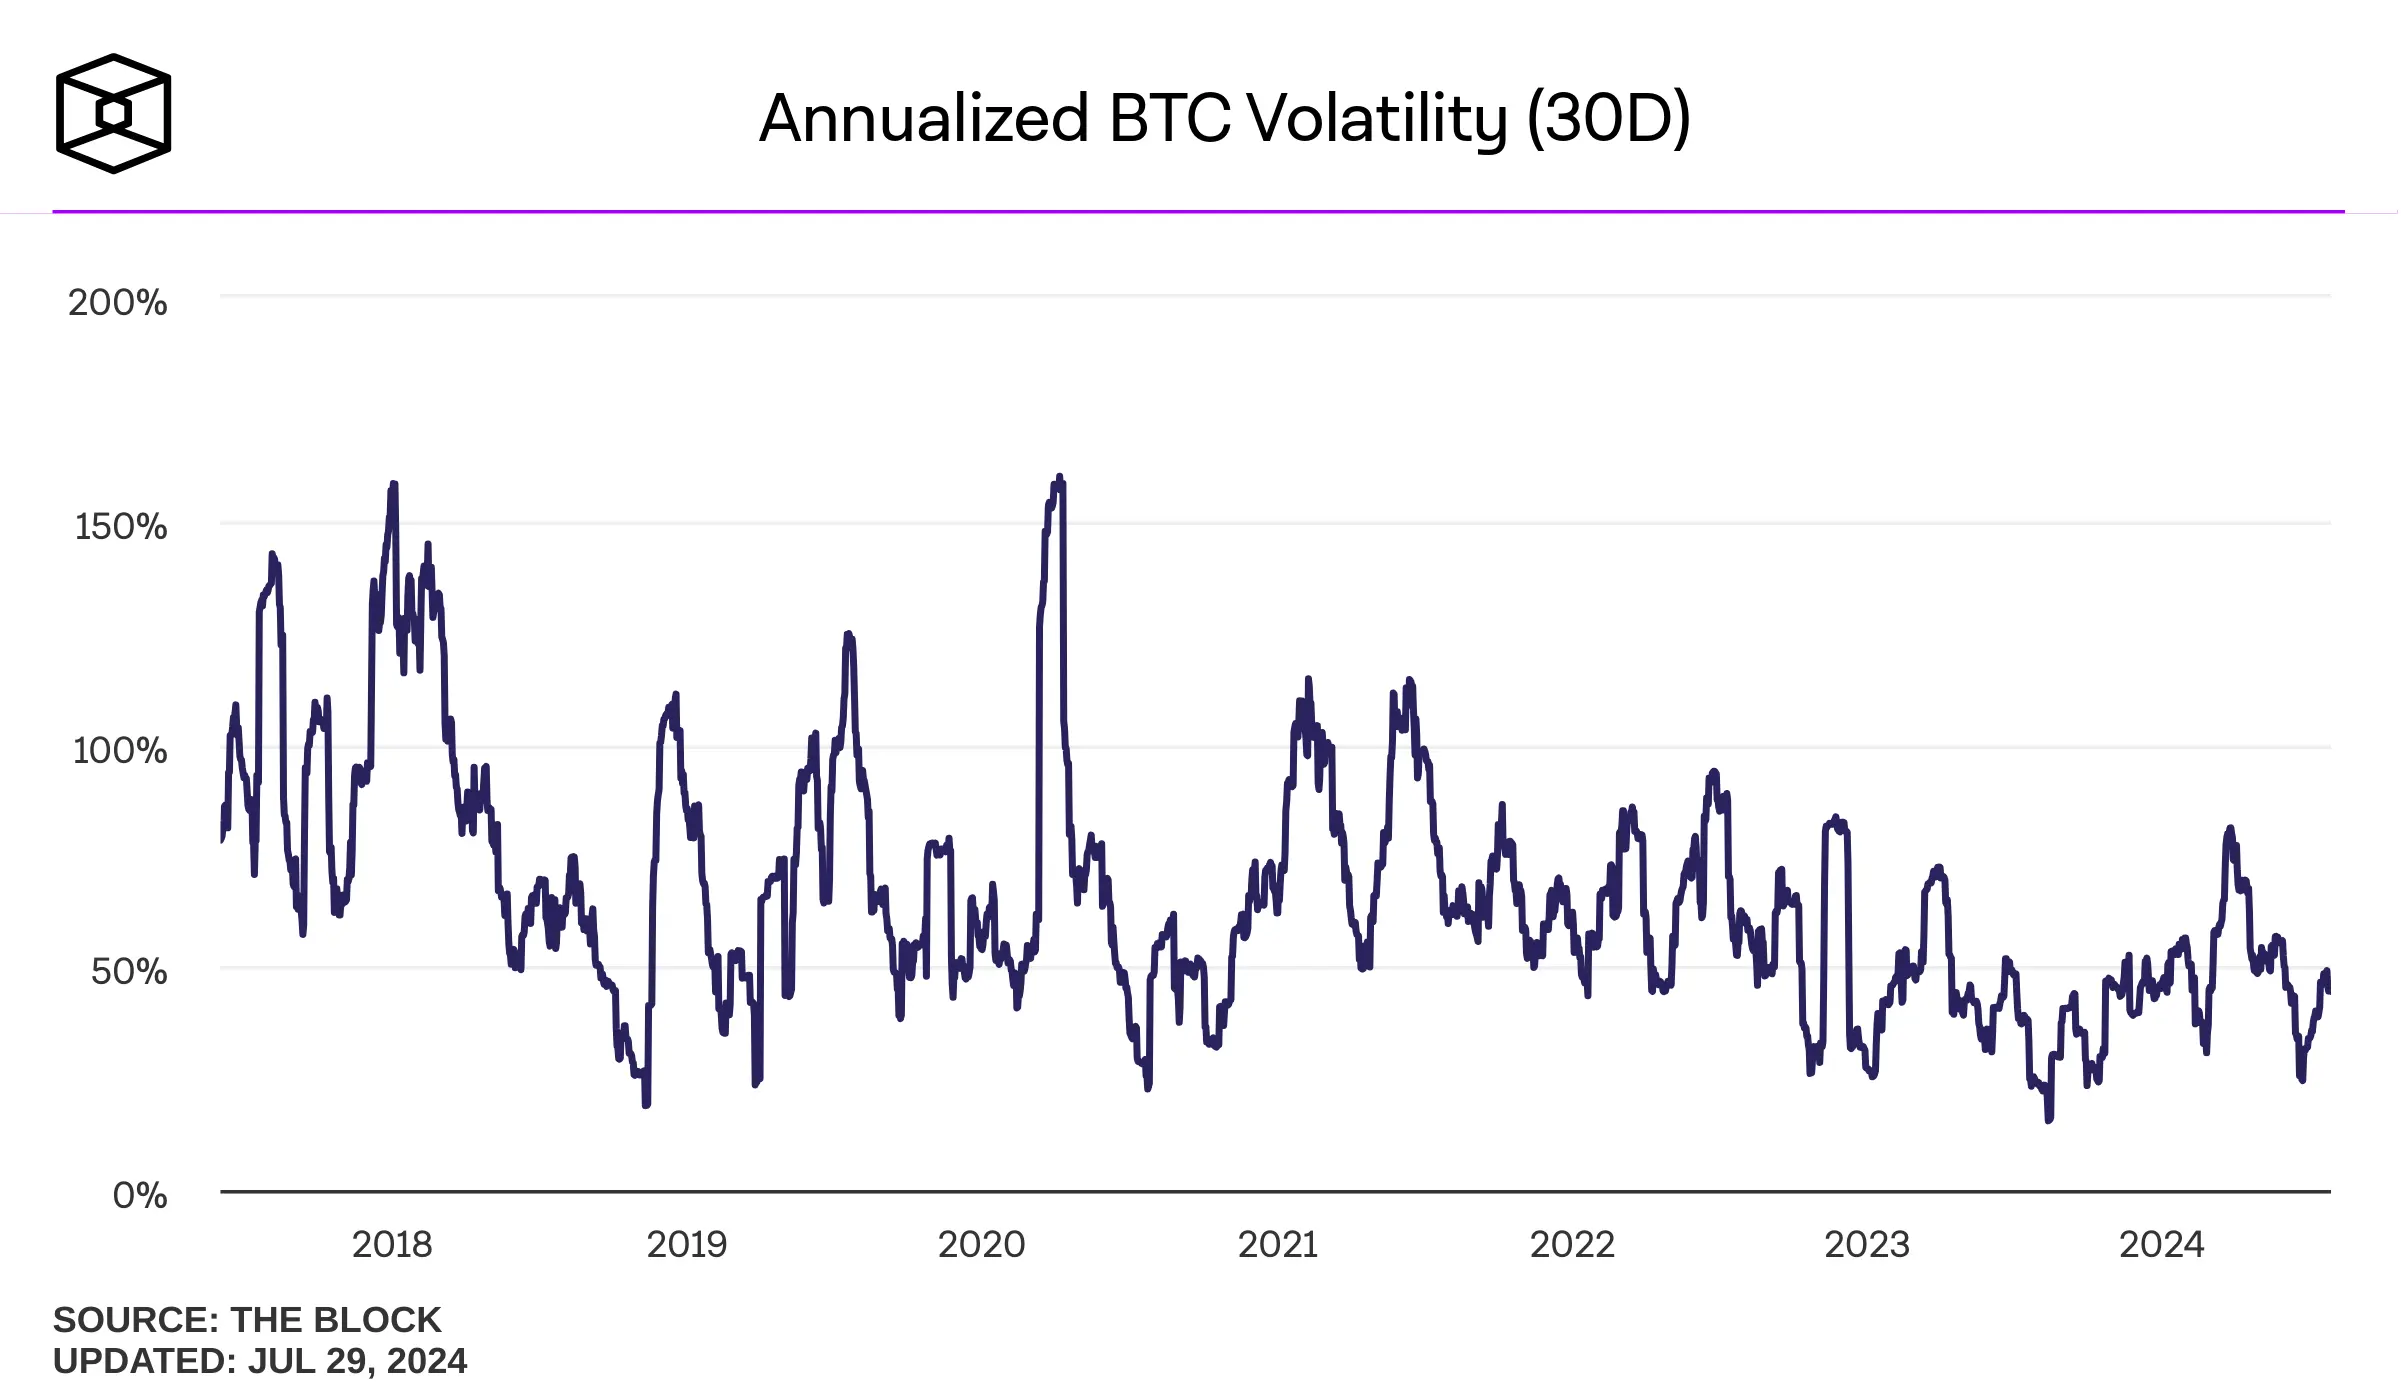
This refers to the degree of change in Bitcoin’s price over time. High volatility means the price can change dramatically in a short period. Bitcoin is known for its volatility; for example, in 2021, Bitcoin’s price ranged from around $29,000 to over $63,000.
3️⃣Market Capitalization
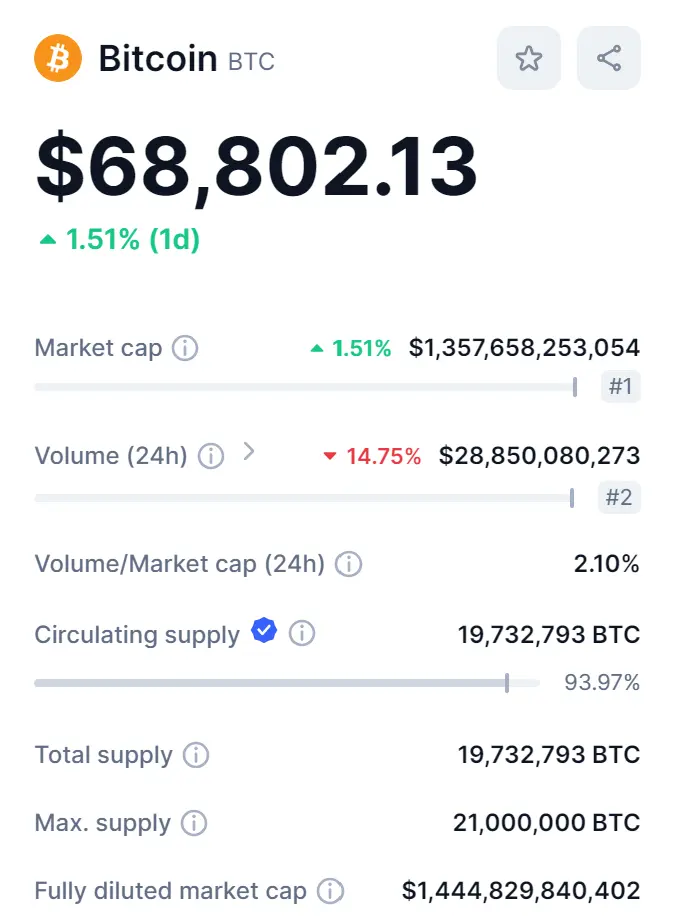
Refers to the total market value of Bitcoin, which is calculated by multiplying the price by the total number of Bitcoins in circulation. Here is a graph that indicates the current market cap and BTC circulation (July 2024).
4️⃣Trading Volume
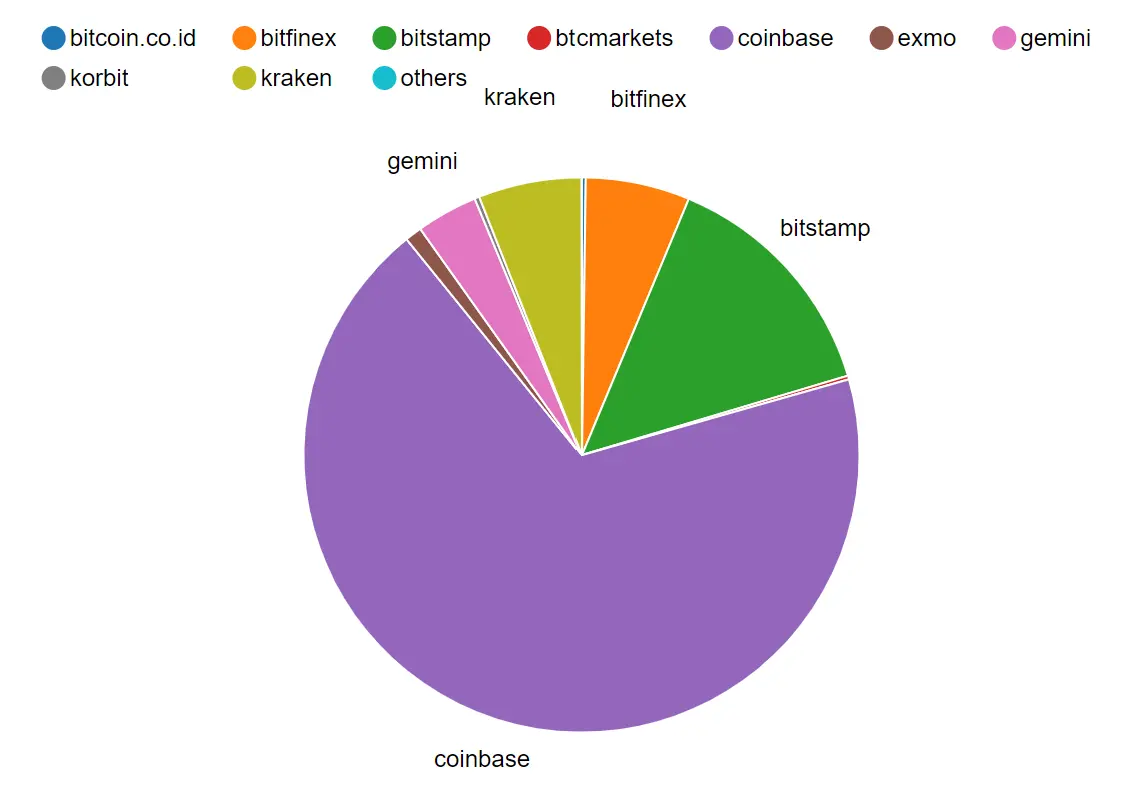
This metric is what shows how much Bitcoin is being traded on exchanges. When there is a high trading volume, that means that the level of liquidity and interest is high on the market.
Here’s a graph of BTC trading volume on the most popular exchanges in July 2024.
As an investor, understanding these metrics will help you immensely.
First, knowing the profitability with ROI will give you a good indicator of how much of an investment in Bitcoin has grown.
This can help you compare Bitcoin to other assets in your portfolio.
Second, evaluating risk and understanding volatility will help you accept the potential for high returns and losses.
Third, Market capitalization will give you a sense of Bitcoin’s influence on the market, indicating acceptance and stability.
Lastly, market interest will show trading volume, which can help you know when to buy and sell your Bitcoin.
When there is a high trading volume, that means that the market is strong and there is high interest. This makes it easier for you to enter or exit the market depending on your investing strategy.
Useful Metric Tools
Once you understand the different types of metrics for assessing Bitcoin, you can use specific tools to guide your investing choices.
The Bitcoin Rainbow Chart is a popular option. It uses a logarithmic regression to visually show Bitcoin’s historical price movements and trends. It uses the colors of the rainbow to represent price ranges and indicate what an investor should do (Buy, sell, HODL, etc.).
Learn more about the Bitcoin Rainbow Chart.
Historical Analysis of Bitcoin Monthly Returns
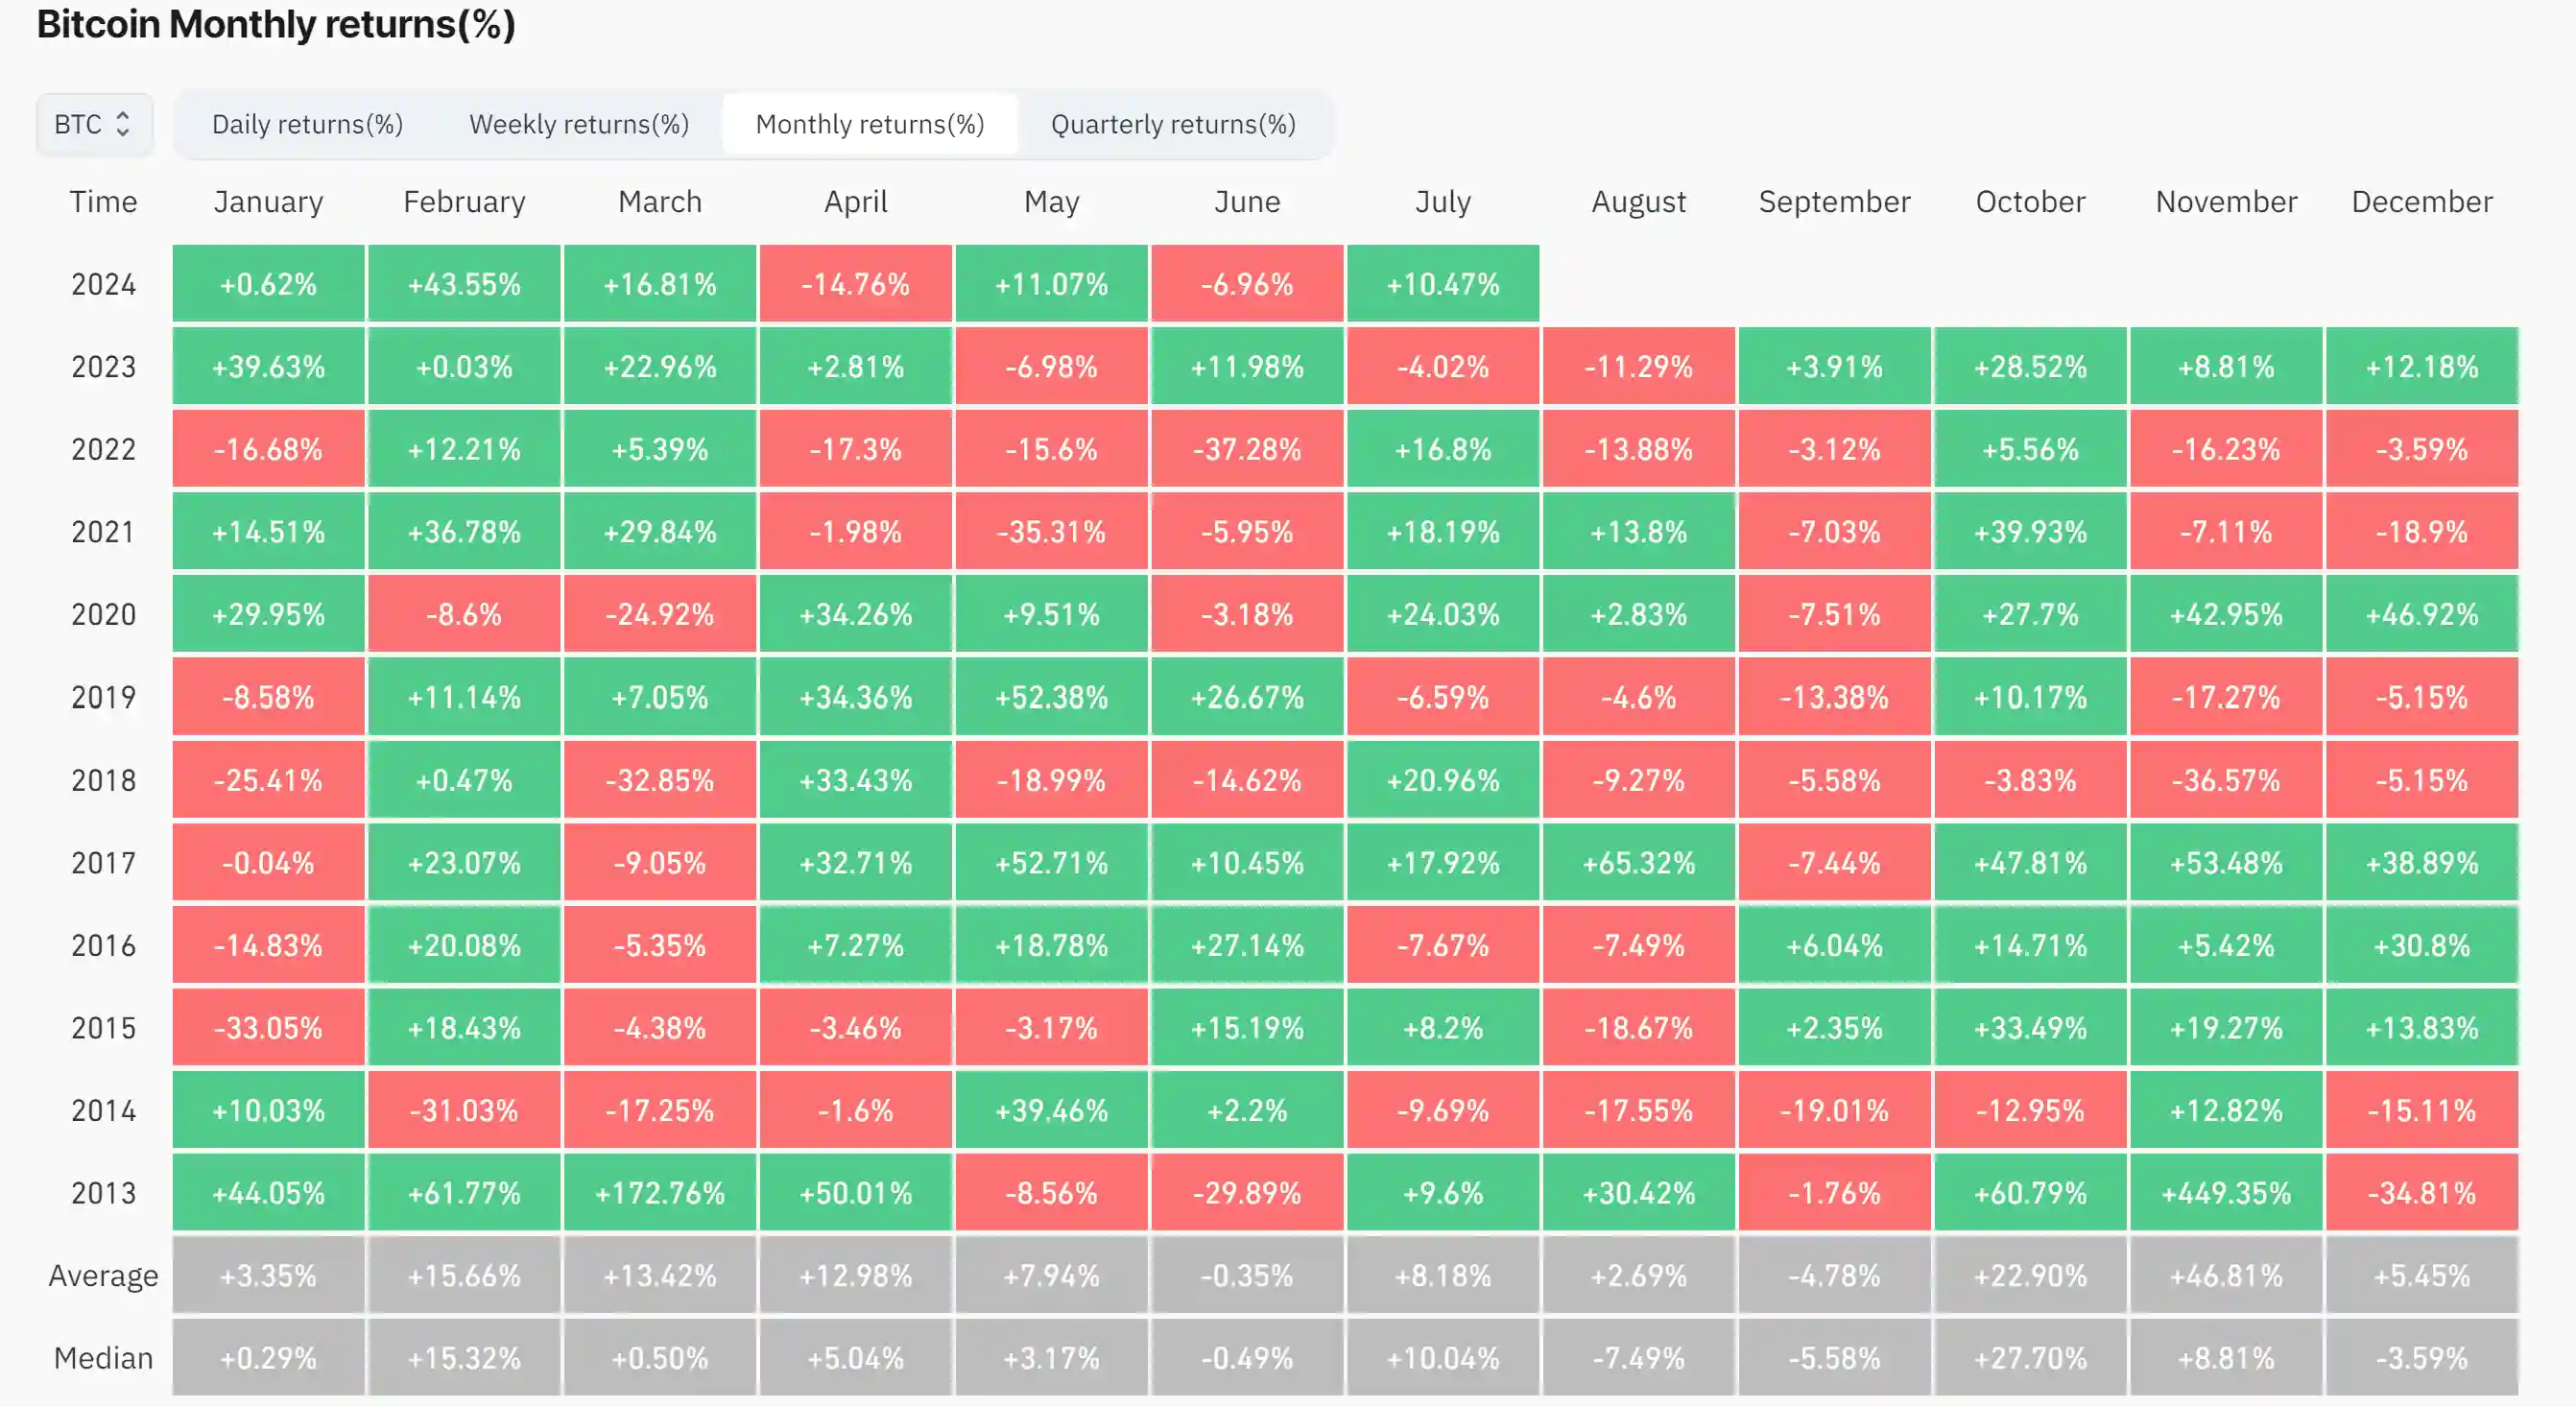
Monthly returns are the percentage changes in Bitcoin’s price from the beginning to the end of each month. These % returns are important because they give insight into Bitcoin’s 30-day performance. This can help you make educated predictions on patterns, trends, and the potential for gains.
Here is an up-to-date chart from when this article was published, demonstrating Bitcoin’s monthly returns.
| November 2013: | Bitcoin experienced its most significant gain of +449.35%, only to drop to almost -35% the following month! |
| January 2018: | The previous December was high, but in the new year, Bitcoin’s price dropped dramatically. This drop marked the start of the long 2018 bear market. Many believe that this was caused by the SEC’s rejection of Bitcoin trading on ETFs. |
| March 2020: | The global COVID-19 pandemic caused the price of BTC to drop by 25% in a single month. |
| 2023-2024: | Overall, the past two years have had a combined positive gain for BTC. There were some minor drops in April and June of 2024, but the overall market has been up. |
From this chart, we can see how BTC can fluctuate and how global events, politics, and other indicators can impact Bitcoin’s volatility.
Material Bitcoin: Best Way for Beginners to Invest
If you feel lost due to the overwhelming amount of information, then finding an easy way to invest and store Bitcoin is your best option.
Material Bitcoin is a user-friendly cold storage wallet that’s perfectly designed for beginners to easily invest in BTC and store it without complications.
Using Material Bitcoin simplifies your investment process as there is no set-up required.
You simply scan the QR code on the metal wallet, purchase BTC directly from the interface, and store it on the indestructible metal wallet.
It’s the easiest way to have you full control of your investments, without the need for third-party exchanges.

Peaks Versus Troughs
As you can see by now, the world of crypto isn’t necessarily a predictable investment. Although the sharp swings give the possibility of making serious gains, knowing when these peaks and troughs are coming can be what makes or breaks your trading portfolio.
Peaks
Bitcoin has experienced many note-worthy peaks throughout its history.
➡️In late 2017, the price of Bitcoin went up to almost $20,000 from $1,000 only at the start of the year.
Many think that this surge occurred because it gained mainstream popularity and media coverage. It was in the same year that Bitcoin futures trading was introduced. This invited institutional investors to the crypto game.
➡️In April of 2021, just about a year after the COVID-19 pandemic, Bitcoin hit a high of over $60,000. This was brought on by general global adoption by companies like Tesla investing $1.5 billion in BTC.
Troughs
Bitcoin has also seen many significant troughs (drops) along the way.
➡️After the 2017 peak, 2018 wasn’t so kind. The price of Bitcoin plummeted during the year to hit a low of around $3,200.
This drop was brought by market fears from regulatory crackdowns security issues and breaches with major crypto exchanges!
➡️March 2020 is a standout trough within Bitcoin’s history. Prices fell to about $4,000.
These peaks and troughs made a big impact on investors. There were big returns made that attracted new crypto investors but the quick drops also led to big losses.
Long-term investors who have held onto their BTC through the ups and downs are the ones who have benefited from the overall upward gains of Bitcoin over the last 10 years. Short-term traders are the ones who have greater risks and losses.
Having a HODL strategy when it comes to Bitcoin investing is thought to be the best approach.
Bitcoin Returns vs. Other Investment Classes
Bitcoin has historically outperformed other traditional investment classes like stocks, bonds, and real estate. Using ROI to your advantage can help you gain higher returns than the next best investments out there, such as the Nasdaq 100 and S&P 500.
Bitcoin’s annual rate of return is 230%, which is 10 times higher than the second-best performing asset class, the Nasdaq 100 Index.
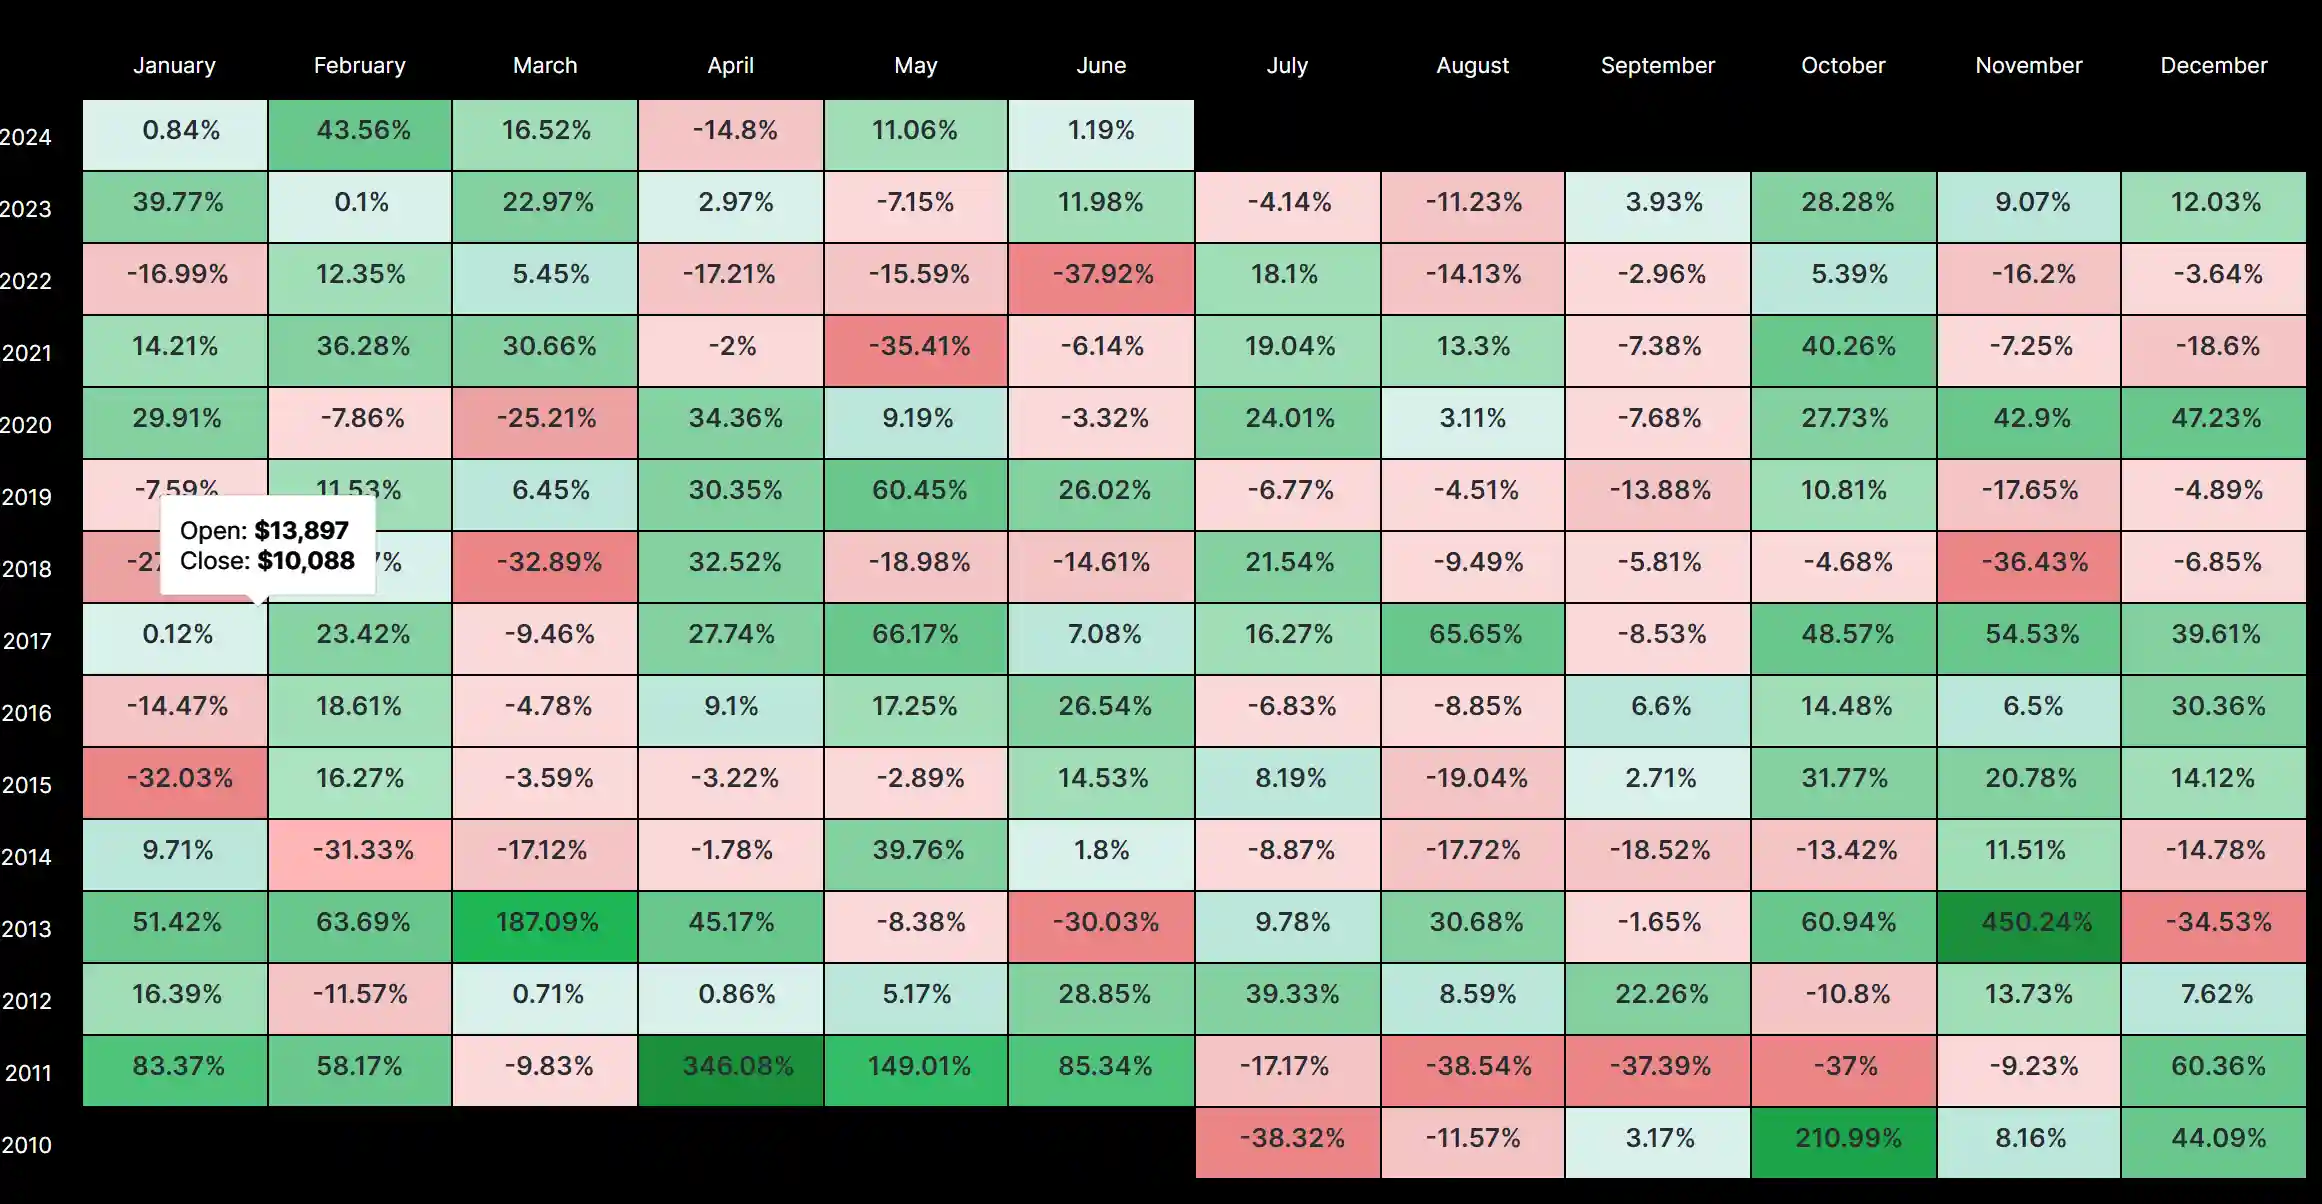
Bitcoin Monthly Performance Heatmap
A performance heatmap is a visual representation that shows changes in Bitcoin’s monthly returns throughout history.
The color green indicates months when the market was positive, the color red indicates months when the market was negative, and orange/auburn indicates drops in the market.
Similar to the monthly return chart posted above, this map is to be a visual representation by color.
Pro Tip: Look for patterns, like consecutive colors over many months, which can signal trends. A sudden color change usually indicates a market change.
Using this visual tool to your advantage can help you make informed decisions on your trades.
Strategies for Investing Based on Monthly Returns
Investing in Bitcoin based on monthly return data means that you must analyze historical performance to identify patterns and predict trends.
Tips For Beginners:
- Using strategies like dollar-cost averaging (investing a fixed amount regularly) can help maximize returns and lower risks.
- Starting with a small investment amount and practicing with Bitcoin paper trading can be a helpful tool.
- Cold wallets like Material Bitcoin offer easy purchasing ability and secure storage.
- Diversify your investments to spread risk.
Predicting Future Trends of Bitcoin Returns
Predicting Bitcoin’s future involves analyzing current market conditions, and historical data.
According to BitcoinWisdom, Bitcoin will reach over $79,000 in 2024, with the potential of reaching $93,000 by 2025.
Remember that Bitcoin’s past performance doesn’t guarantee its future results, but it’s a great tool for indicating possible trends.
Stay up-to-date on current market conditions, regulations, political influence, and world events to keep you informed about the possible peaks and troughs of Bitcoin.
FAQ
What is the average return on Bitcoin?
- Last year’s return was 105%.
Where will Bitcoin be in 5 years?
- Predictions vary on this, but many experts think that Bitcoin could reach between $100,000 and $300,000.
What is the 10-year performance of BTC?
- Over the past 10 years, Bitcoin has seen a return of over 58%.
Where will Bitcoin do in 10 years?
- The future performance of Bitcoin remains uncertain, but experts expect it to continue growing as more countries accept it and people use it for more purchases and trades globally.




0 Comments