What sets all these currencies apart is the technology, encryption, and philosophy they use.
Is crypto going up or down is a question that almost everyone struggles with. But, how can you know if a cryptocurrency is going to go up or down at a certain moment?
Here you’ll find the answer.
How to know if a cryptocurrency is going to go up or down
When an investor considers starting to invest in cryptocurrencies, the first thing they usually feel is fear.
For this reason, it is wise to inform yourself well about what you are going to do before investing.
Another big problem investors face is knowing when the cryptocurrency price will go up or down..
Knowing how to predict the price of bitcoin, and cryptocurrency price prediction in general is not easy, but there are several factors, such as regulations and technical breakthroughs, that can influence unexpected market fluctuations.
Many users buy a cryptocoin when its price is too high and sell it when it is already too low. careful! This is a mistake.
To avoid having losses on your investment, you have to be well informed about the movements of the market in real-time and the project behind the cryptocurrency, this will give you a better understanding of how to predict crypto price. Using tools like Coinmarketcap(worldwide ranking of cryptos and exchanges based on different criteria) or TradingView is highly recommended in these kinds of circumstances.
If you need to track multiple cryptocurrencies using multiple charts simultaneously, you can visit Cryptowatch, which uses TradingView’s charts and tools, allowing you to view multiple charts at once and customize them.
What Makes a Cryptocurrency Go Up or Down?
The easiest way to find out about any possible fluctuation in the market is by monitoring the exchanges and the movements of buying and selling bitcoin around the world.
⏯ For those who do not have enough time to devote to crypto trading, some online forums or chats that are up-to-date on the changes that occur daily.
⚠ Another way to be on top of the market trends is to spend time reading the opinion of experts on the subject, bitcoin market analysts, and crypto price prediction specialists. Bots can also be used to perform market monitoring jobs.
Best cryptocurrency trading signals
Cryptocurrencies are a very volatile value. Therefore, it is difficult to define the perfect time to invest in them.
However, it is possible to identify certain cycles that repeat themselves over and over again. There are some cryptocurrency signals that can help us when making decisions.
1️⃣ The degree of adoption by users.
2️⃣ Innovation and development.
3️⃣ Mayer’s multiple.
4️⃣ The values of the SOPR (Spent Output Profit Ratio).
5️⃣ The MVRV ratio (Market-Value-to-Realized-Value).
6️⃣ The liquidity of a cryptocurrency.
7️⃣ Technical trading indicators.
Signal 1: The degree of adoption
The value of cryptocurrencies varies depending on the supply, demand, and commitment of users.
The more speculation there is for a cryptocurrency, the lower user adoption tends to be.
For example, if a crypto today costs 1 dollar, tomorrow 5 and the day after tomorrow 0.5; It will not have much credibility in the eyes of users.
Signal 2: Innovation and development
Cryptocurrencies have become a disruptive innovation for society because they define a new paradigm in the interactions between the agents of the economy: they secure electronic transactions without the need for an authority to control them.
If a cryptocurrency is not in continuous development, it risks falling into oblivion.
What is the innovation behind Bitcoin?
Bitcoin allows real-time transactions. A transfer can be completed in as little as 20 minutes.
Signal 3: Mayer Multiple
It serves as an indicator to know if a token is in a bearish phase when its value is less than 1.
The Mayer multiple is the multiple of the current Bitcoin price over the 200-day moving average.
Furthermore, simulations carried out in the past confirmed that the best long-term result was achieved by accumulating Bitcoin as long as the Mayer Multiple was below 2.4.
Signal 4: Values of the SOPR
It reflects the degree of gains and losses realized by all the currencies that move in the chain.
This indicator tells us when important changes occur in the price thanks to the data that is uploaded to the blockchain.
In short, it is the realized value (USD) divided by the value at creation (USD) of the output:
- Price Sold / Price Paid.
Historically, the indicator has reached values between 0.9 and 1.35. A value of one means that the market is in a neutral state.
Signal 5: The MVRV ratio
Measures the relationship between the market capitalization of an asset and its realized value.
It is a metric used to analyze long-term cycles, identifying how much the Bitcoin market is profiting concerning the volume of crypto assets traded.
- Upper limit: 3.7. If the MVRV moves above this level, it indicates overvalued Bitcoin.
- Lower Boundary: 1. If the MVRV moves below this level, it indicates an undervalued Bitcoin.
MVRV is an excellent indicator of the ups and downs of Cryptocurrencies, mainly for Bitcoin. MVRV spikes indicate that the market is at its peak, while MVRV dips occur when the market is in an accumulation period.
Signal 6: Liquidity
Crypto liquidity is the ability of a currency to be easily converted into cash or other currencies. In such a way that the easier it is to convert an asset into money, it is said to be more liquid.
Cryptocurrencies that have low liquidity have a big difference between supply and demand.
Be careful, it will cost more to buy them.
Signal 7: Technical Trading Indicators
Traders should not clutter every chart with every available indicator.
Using too many indicators will only hinder the process in cryptocurrency trading and create confusion.
There is no perfect set of indicators that gives better results than others, it is just a matter of preference and practice.
The following indicators can help you detect if a cryptocurrency is going to go up or down in the short term.
- Divergences
When divergence occurs something goes wrong.
The price is lying to you, the trend is going to change in the direction that the indicator warns.
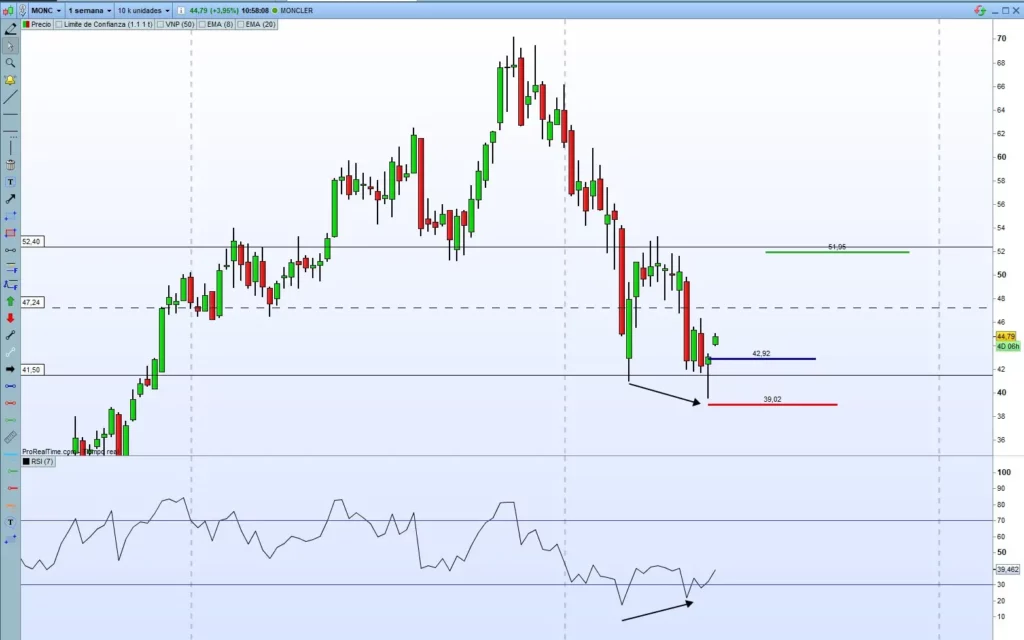
As you can see in the image, the price is going down, but the divergence informs you that there is going to be a change in the trend (until then it was bearish, but now it will go up again).
2. The volumen
A price range in which a lot of volume accumulates is a level that market participants consider important. And this interest in buying or selling is what causes the relevant support and resistance to form.
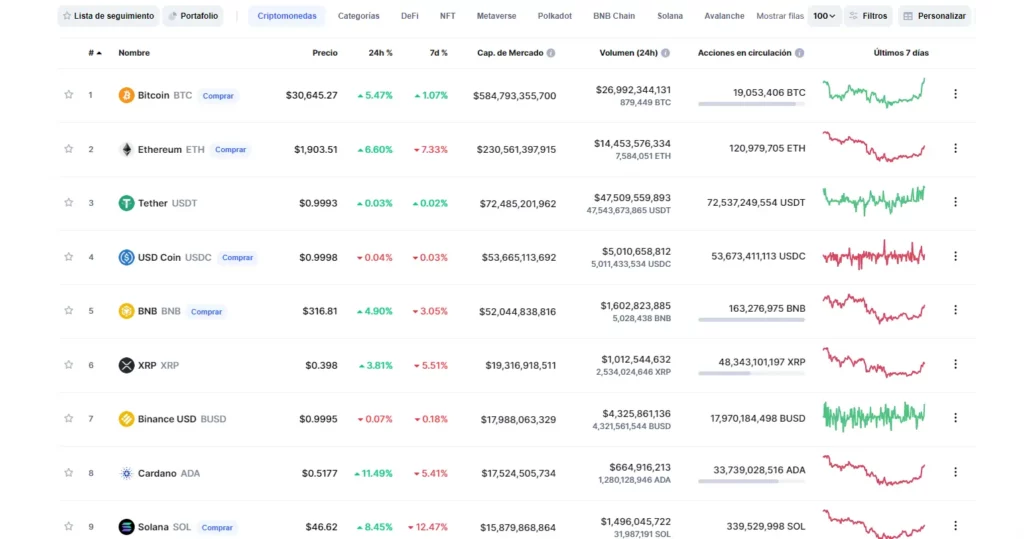
In Coinmarketcap you can see the volume that each cryptocurrency has had during the last 24 hours. It’s funny, as sometimes some cryptos that you don’t expect appear.
3. Candlestick chart
This is perhaps the most common way to assess the price of an asset.
There are ascending candles (green color) and descending candles (red color).
Each candle represents the price change in a specific time interval (30 minutes, 1 hour, 1 day, 1 week, and 1 month). The lines that appear outside the candlestick represent the low and high during a period.
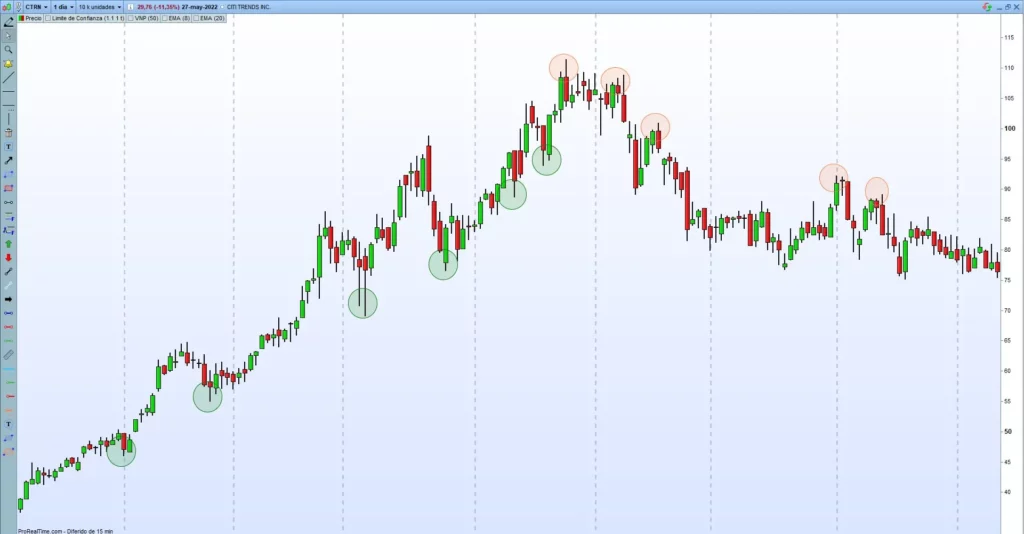
The simple fact of looking at the chart and marking a few levels will give you the most valuable clue to be able to trade it.
If you look at the chart, mark the most relevant levels and look at the price peaks, you will be able to see how in a trend it marks increasing highs and lows, and as it gets closer to a level that you have marked, that sequence is lost and decreasing highs start to appear.
That is when you should put into practice the Entry Techniques, to know if it pays you to enter right in that (probable) trend change, or is it better to wait.
Conclusion
When it comes to finding and identifying cryptocurrency signals, many patterns that can serve you well.
Like everything in life, it depends on your criteria and your preferences. In general, the most effective (in my opinion) will be to take into account the crypto price action, because it is what will confirm that this change in trend has already occurred.
In this article, I wrote down my favorite signals, but it does not mean that you have to use them all.
Knowing how to read cryptocurrency charts will be a huge advantage when trading cryptocurrency. It will give you an idea of when to enter or exit a trade, increasing your profitability.
However, each one of them has its key factors to dominate the world of trading. Remember to invest wisely.




0 Comments